Chip Huyen, co-founder and CEO of Claypot AI gave a presentation entitled “Platform for Real-Time Machine Learning” at Snorkel AI’s Future of Data-Centric AI virtual conference in August 2022. The following is a transcript of her presentation, edited lightly for readability.
Hello, my name is Chip. I’m a co-founder of Claypot AI, and I assist with machine learning AI systems designed at Stanford. Snorkel is one of my favorite companies, so I’m really excited to be here today. Thank you so much for having me. I’m going to talk about a platform for real-time machine learning, and I want to start with a little story.
So recently I went to an e-commerce website to look for a work-from-home setup. So I started looking into a monitor, keyboard, standing desk, mouse, and I kept hoping that the website would be able to understand what I was looking for and just tell me, “Hey, this is a great product that you need, just buy it.” However, after fifteen minutes, the site was still trying to sell me mattresses, so I left the site because I couldn’t find anything I wanted there.

My experience was not unique. In a survey that a friend shared with me, 40% of shoppers said they would leave a site if they’re shown irrelevant recommendations. And so you might wonder, what if we look at a user’s historical data to share recommendations relevant to them? And that is, in fact, how a lot of companies are doing things nowadays. But that’s not sufficient. Most users are not locked in or are not locked in frequently enough for a site to have sufficient historical data. For example, 70% of shoppers are only locked into a site once or twice a year, which means that to be able to generate relevant recommendations, we have to look into each user’s most recent activity or in-session activity to generate recommendations.
So real-time machine learning is an approach to enable machine learning models to leverage the freshest data, to make the most relevant predictions, and to update themselves or retrain to adapt to changing data distributions. And that’s the topic that we will talk about today. So I’ll cover three topics: first, online predictions, and then continual learning, and then real-time monitoring, which is extremely important to enable continual learning.
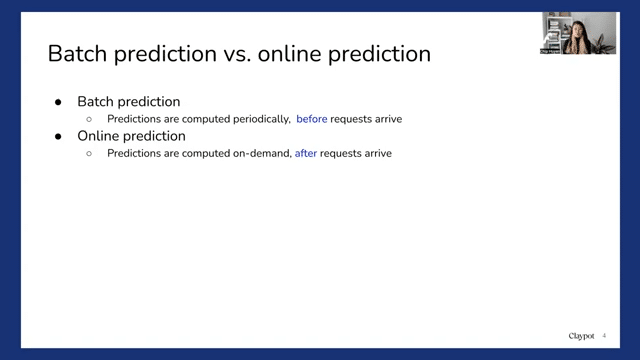
So online predictions sit in contradiction to batch predictions. Batch predictions refer to when predictions are computed periodically before a request arrives. For example, on Netflix, they might look at all users and generate movies that each user might want to see next every four hours. Online predictions mean that predictions are completed on demand after a request arrives. So instead of sharing recommendations beforehand and caching those predictions and then showing the predictions to users when they log in, they just wait for users to visit the website first and then look at their activities and make recommendations.
So batch predictions are a way to avoid latency because you generate predictions beforehand, so you don’t have to worry about how long the prediction will take. However, online predictions have strict latency requirements because you don’t want users to wait forever to see recommendations or other activities.
However, batch predictions might mean a lot of wasteful computing. For example, on GrubHub, only 2% of their users actually make an order per day. But they have to generate restaurant recommendations for all users every day, which means that 98% of predictions actually may not be used. Online predictions now allow us to make more adaptive and more relevant or useful predictions because we make sure to only generate predictions when users are sure they need the predictions.
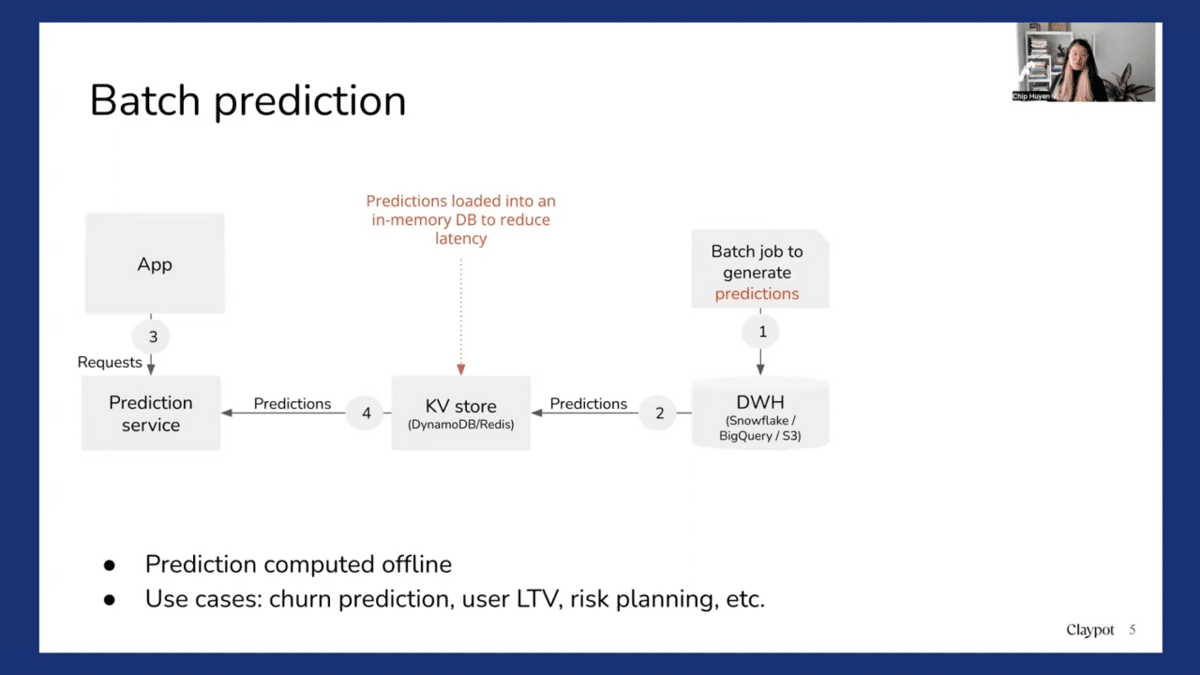
So from an additional perspective, batch prediction looks something like this. First, you generate predictions and you store them in a data warehouse. And then you might want to load them into some key-value store like a database or Redis for faster retrieval. And then you receive a prediction request from the apps and you fetch the pre-computed predictions. And it works for a lot of use cases, for example, churn predictions or predicting users’ lifetime value or risk planning. So you don’t really need to do online predictions for those use cases.
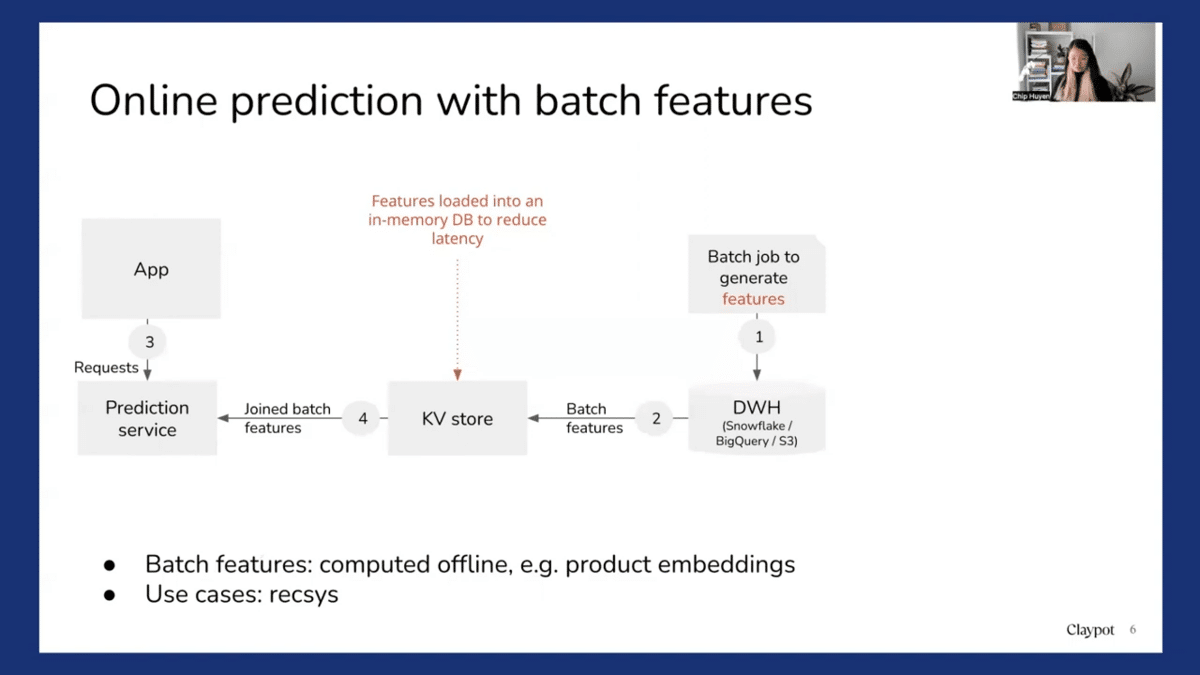
So another setup is online predictions with batch features. So in this case, predictions are made online, but using pre-computed features. For example, with recommender systems, you might want to pre-compute all the product embeddings. And so first you compute all the embeddings and even load them into a key-value store for faster retrieval. And then when a user visits a site, you look at all the products that users have looked at recently, and then you fetch the embeddings corresponding to this product. And then you use those predicted embeddings to make predictions on what items users are going to want to use next. It’s an extremely common setup.
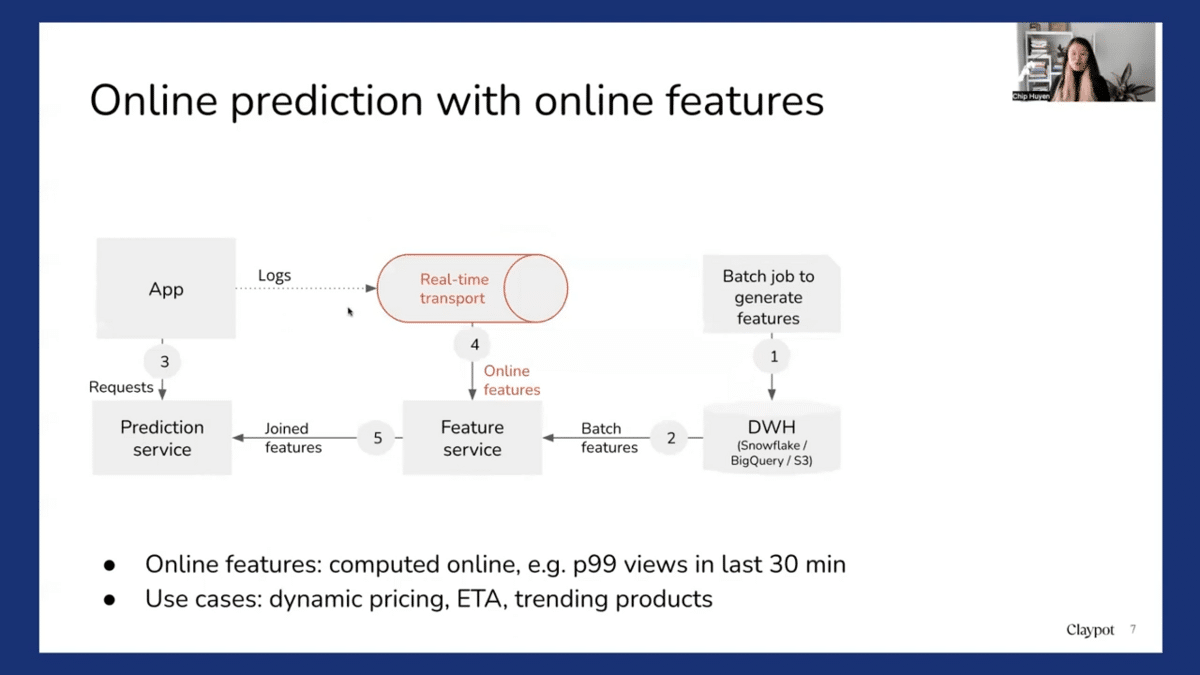
Another setup, which is more advanced, is when you do online predictions, not just with pre-computed features, but also with features that are computed on demand. For example, to make more relevant recommendations for the product, you might want to use not just the product embeddings, but also other product features, like how many times a product has been looked at in the last 10 or 30 minutes. Maybe there’s some trend and suddenly the product is really popular and a lot of people want to see it. So you might want to show the trending product as well. How many views a product has had in the last 10 minutes is an online feature that can be computed in real-time. Many use cases can benefit from online predictions with online features and batch features. For example, dynamic pricing, estimated time of arrival predictions, and online training products.
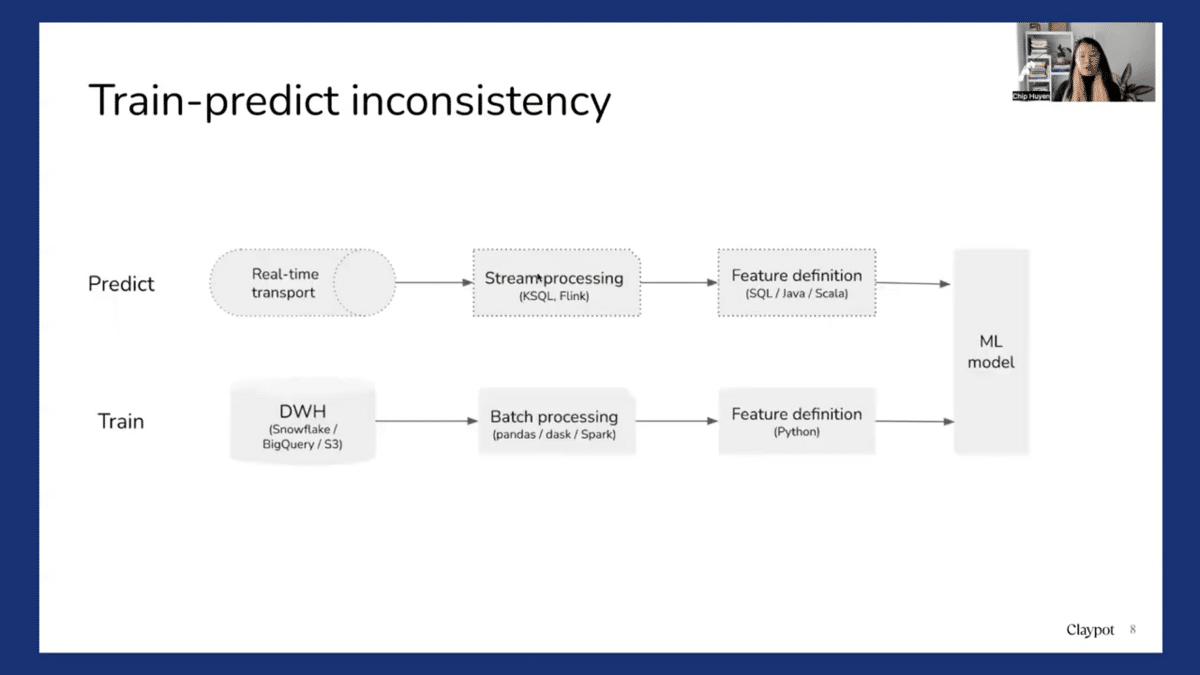
So when we do online predictions with online features, a problem emerges, which is a train-predict inconsistency. So during training, we might have all the features computed in batch, using historical data and a batch processing framework like Pandas, Dask, or Spark. Whereas when we do online predictions, these online features are computed online, perhaps through a stream processing like KSQL or Flink. So now there’s an inconsistency. So training features are computed in batch, but the predict features are computed using stream processing. This is a problem that has created a lot of headaches.
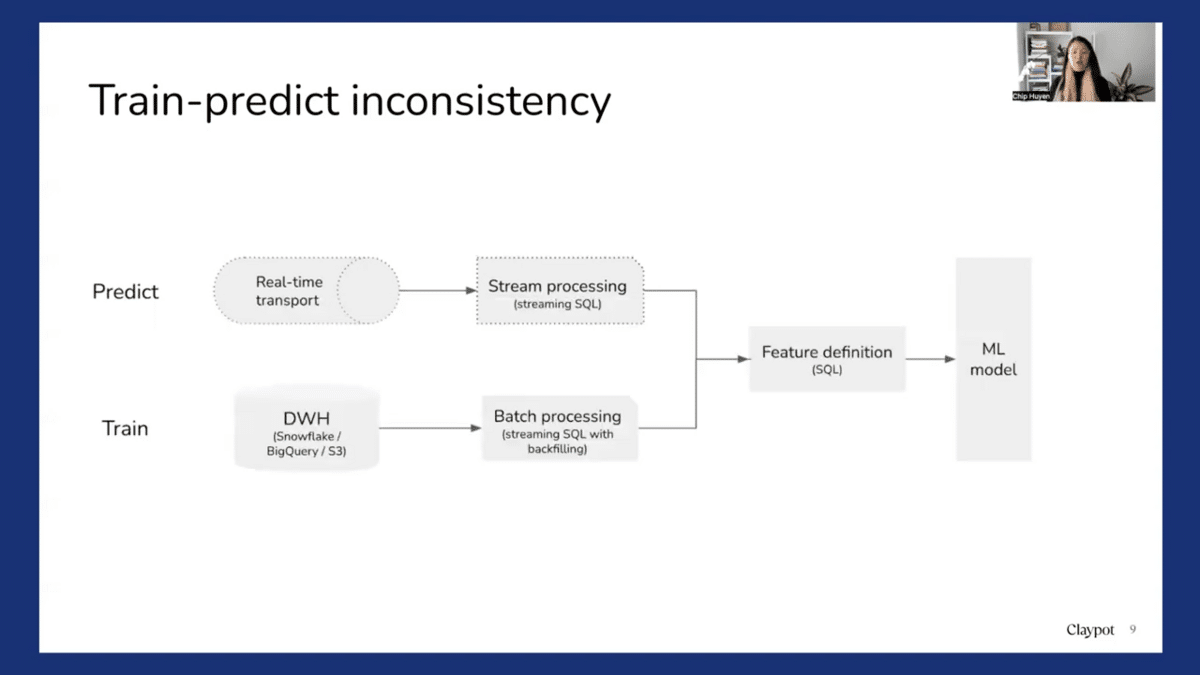
So there are various ways to go about it, but one way that we’ve seen a lot of companies adapt successfully is to leverage stream processing as a base. So what that means is that when we write feature definitions, instead of writing them in Python, we write the feature for the online prediction process. So we write a SQL definition. And then during prediction, we can use stream SQL to compute these SQL features. And if we want to generate data for training, we can apply these same feature definitions, but apply them to a backfill process so we can compute these features for historical data. And that way we can ensure consistency between training and prediction. And it’s a very common approach for feature stores, such as Tecton.
Okay, so we talked about predictions, now we’ll talk about continual learning. Deploying a model is easy if you ignore all the hard parts, and that’s a quote we got from our friends at Square. So a lot of industries today are still doing easy deployments.
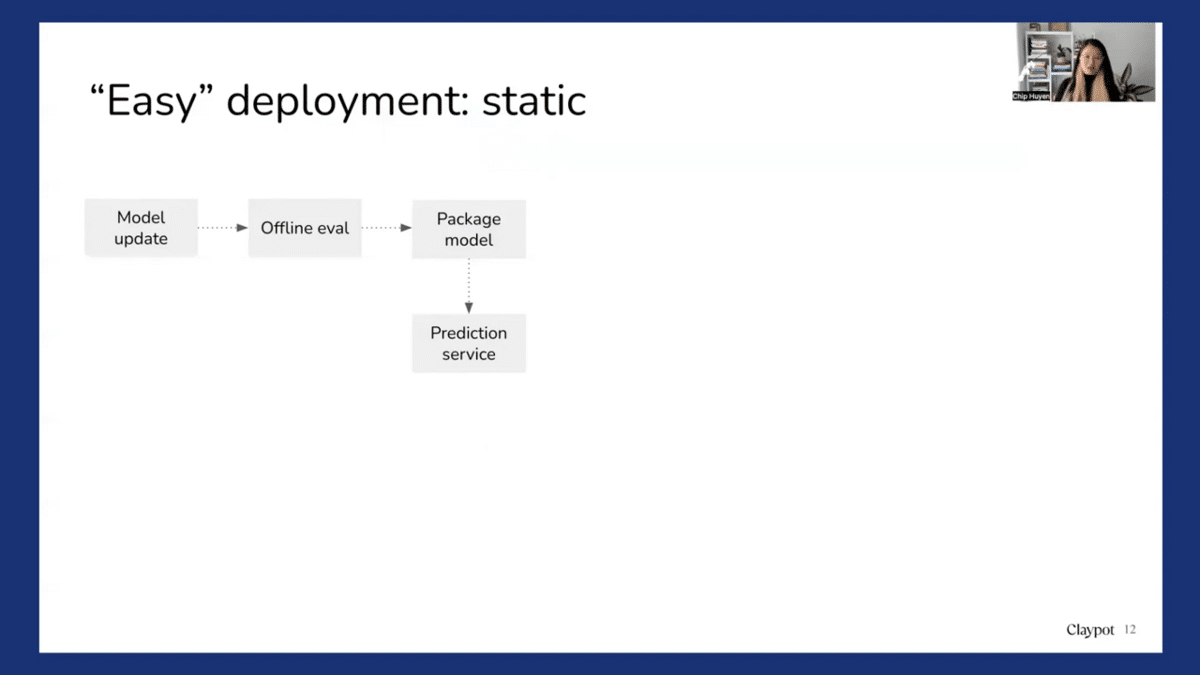
Easy deployment means that we look at deployment as a static, one-off process. So we have a new model, we do some ad hoc online evaluations, we package the model, and then we ship that model to a prediction service. So it’s easy. We do it, not because it’s the right thing to do, but because it’s easy. And it’s easy now, but it’s going be very difficult later, because when we ship a model operation service, if the model fails, we have no idea. We have seen a lot of cases where the model fails for weeks and nobody figures it out until somebody decides to explore the model prediction output.
And if there’s no way to close the loop, the model update process becomes very ad hoc and painful and requires many people. For example, one person needs to go into a data warehouse with the data sources to generate the relevant data, do the feature engineering and train the model, and then hand it off to another team to deploy. So that’s why we see a lot of companies only update their model once every six months or once every year. And after a year, the world has changed a lot and the model is no longer very useful.
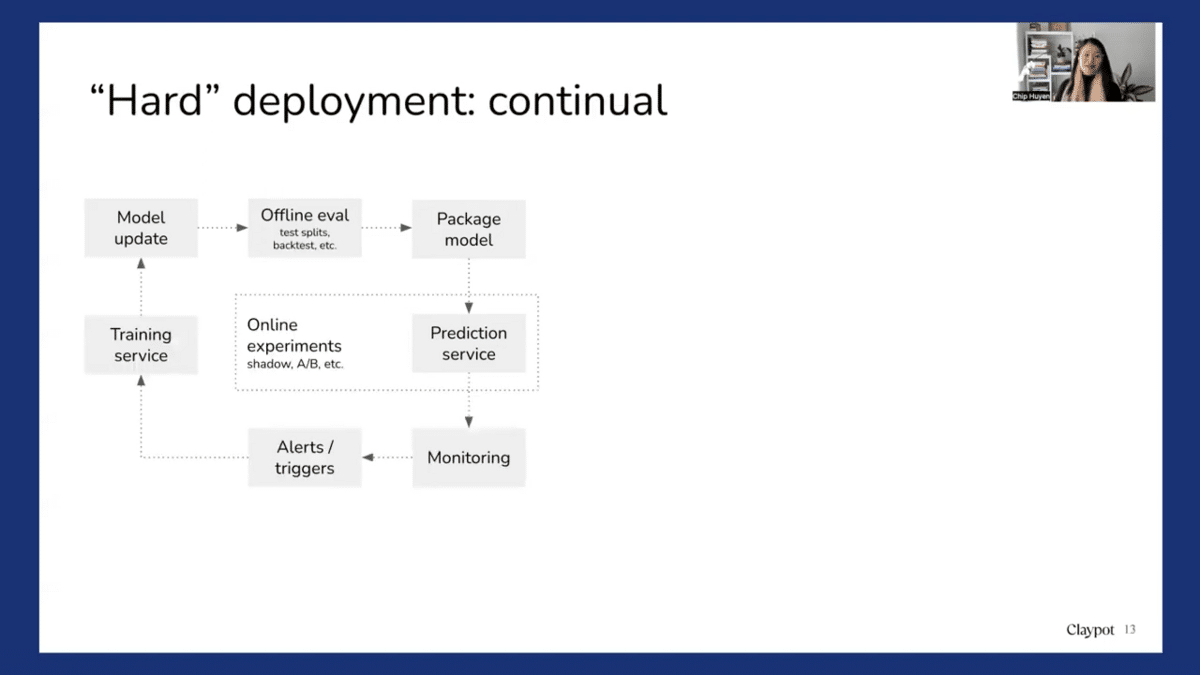
So when we are pushing a model to workplaces, that’s what we call “hard” deployment or deployment as a continual, never-ending process. So you have the model update, you do some offline tests, you can package the model, and ship the entire prediction service. And we see that the prediction service has to be very tightly coupled with online experimentation. We see that many companies have an online experimentation platform that is separate from the prediction service. And what that means is that it’s very hard to assign these to a schedule like shadow deployments or an A/B experiment.
To actually deploy a model, imagine that you have done all the necessary online experiments and you need to monitor the model. You need to have some setup, like other triggers that can trigger retraining and call the training service. We need to figure out a way to gather data either from the prediction service joined with relevant labels or from other sources. And there’s a new updated model, and then you go through the same exact process.
People think of continual learning as something that means that we have to update the model every five or ten minutes, which is not really the case. Continual learning just means that like we have a way to automate the model retraining. We can do it on-demand and we can do it stateful or stateless.
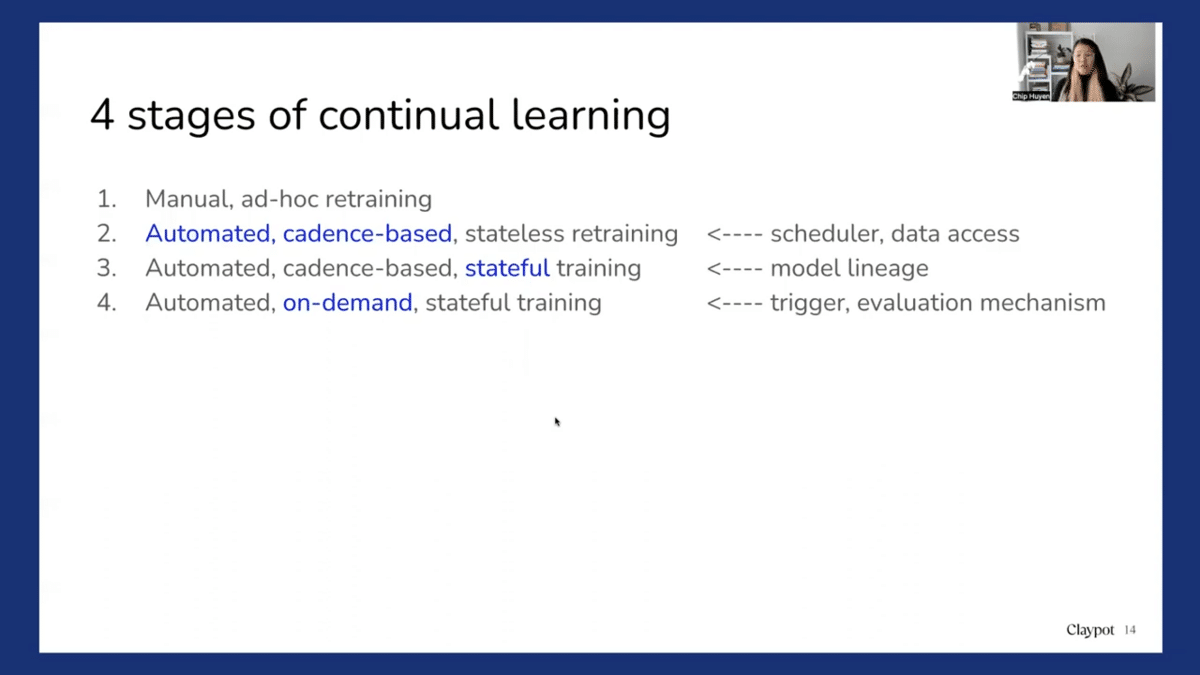
So here we break it down and show the four stages of continual learning. So the first stage is just manual, ad hoc retraining. So maybe whenever someone has free time, which can be never, you look into the data and you retrain the model, and then manually push the new model.
The next stage is when you want to have some kind of automated cadence-based training. So you might want to write a script to automatically fetch data, compute features, and retrain the model, maybe once every day or once every week. And this process is with stateless retraining, which means that the model is trained from scratch each time.
The next stage is when you do the same automated cadence-based retraining, but you can do stateful training. So instead of training the model from scratch each time, we train the model from the last checkpoint. So for example, if you want to train the model every week, instead of training on all of the data from the last three months or the last six months, we only continue training the previous model on data from the last week.
So stateful training is quite neat. Experimentally we have seen that a lot of companies can reduce a lot of training time because instead of training on data from the last six months, we only have to train it from the last week. So the training process is shorter and also somehow the model converges faster and with better accuracy.
And so the last stage for continual learning is instead of having a cadence-based retraining every week, month, or day, we can have on-demand retraining. So whenever there’s a trigger for model retraining, we retrain the model. For example, if suddenly we detect some distribution shift, then we trigger more retraining using the latest data. Or whenever we realize that model performance is low, or there is some other sort of trigger, like all of the prediction requests return zero for some reason, then it also triggers retraining. So this automated, on-demand stateful training is a version of continual learning.
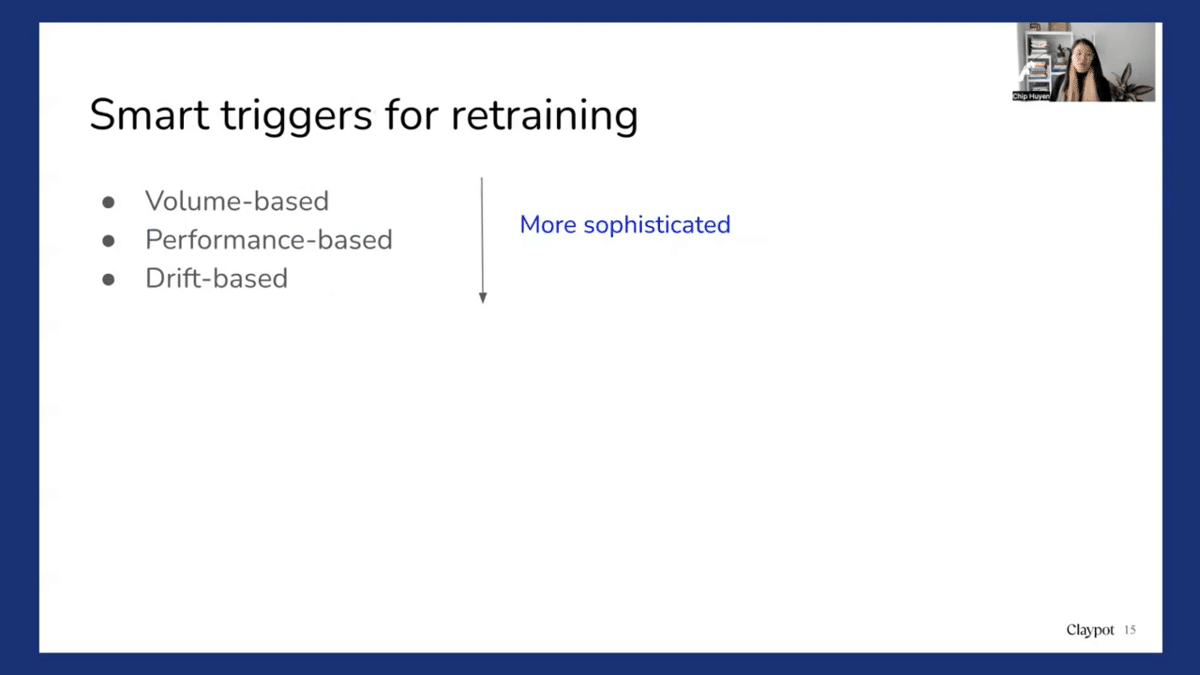
There are different smart ways to trigger retraining. The simplest one is just a manual trigger or a cadence-based trigger. But there are more sophisticated triggers. First of all, volume-based. We work with a lot of B2B companies and for B2B companies, they work with multiple customers or clients. Each customer or client has their own model and their own data. And some customers bring more traffic than others, so they don’t want to retrain all models for all customers at the same cadence. They want to say, “Oh, whenever a customer has data exceeding this amount, let’s retrain the model”. There is also performance- and drift-based retraining; drift-based is extremely hard to do. There are three challenges to continual learning or continual deployment, and we’ll now go through each of them.
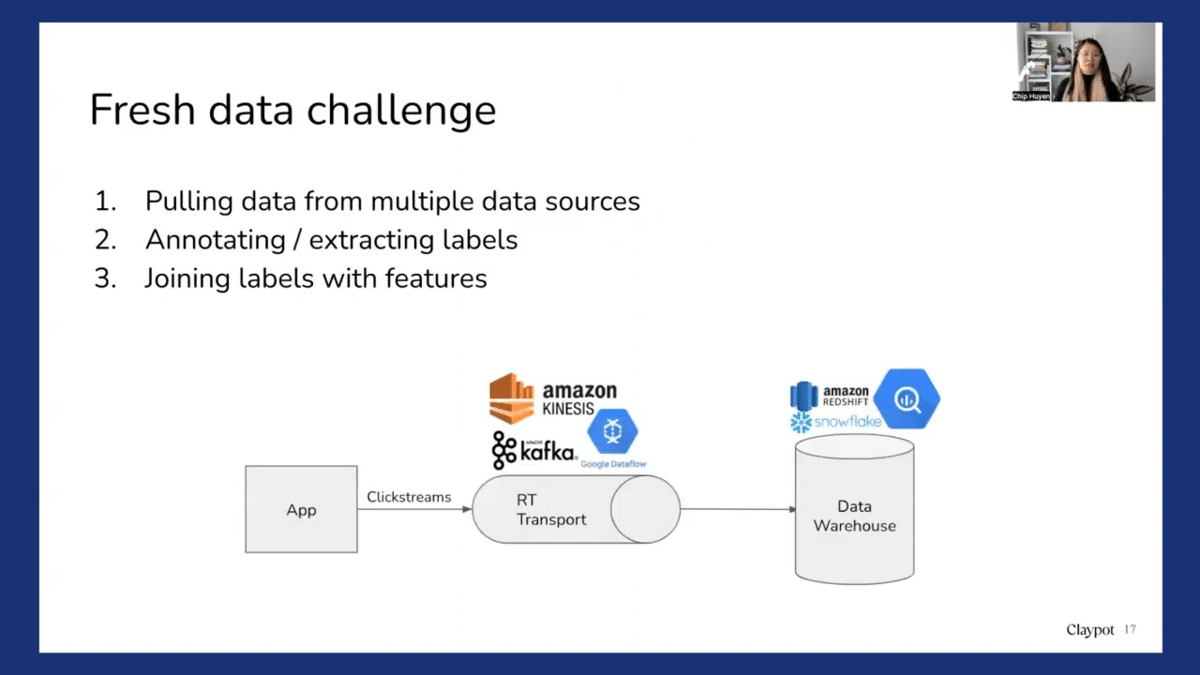
The first is the fresh data challenge. We should be able to continually train the model on fresh data. So we need to access fresh data. Which means that we require someone to pull data from multiple data sources. So you might have some data in a data warehouse, you might have some data in real-time transport, or you might have third-party data.
And for a lot of companies that I have seen, the process of gathering data from multiple data sources is the most time-consuming part. And then of course, if you do supervised learning, we need labels for the model. So in some use cases, we have natural labels. So for example, like ETA or recommended systems or click-through, then we have natural labels for recommended systems. Maybe we assume that if they click on our recommendation, then it’s a good recommendation, and if they don’t click on our recommendation, then it’s not. So that gives us the labels. We can track labels from the clickstream. But for many use cases, we need to annotate the data. So that is when solutions like Snorkel come in really handy because Snorkel allows us to generate labels for the new data very fast. And then of course we have to join these labels with features of the new model if we have new features so that we can generate new retraining data.
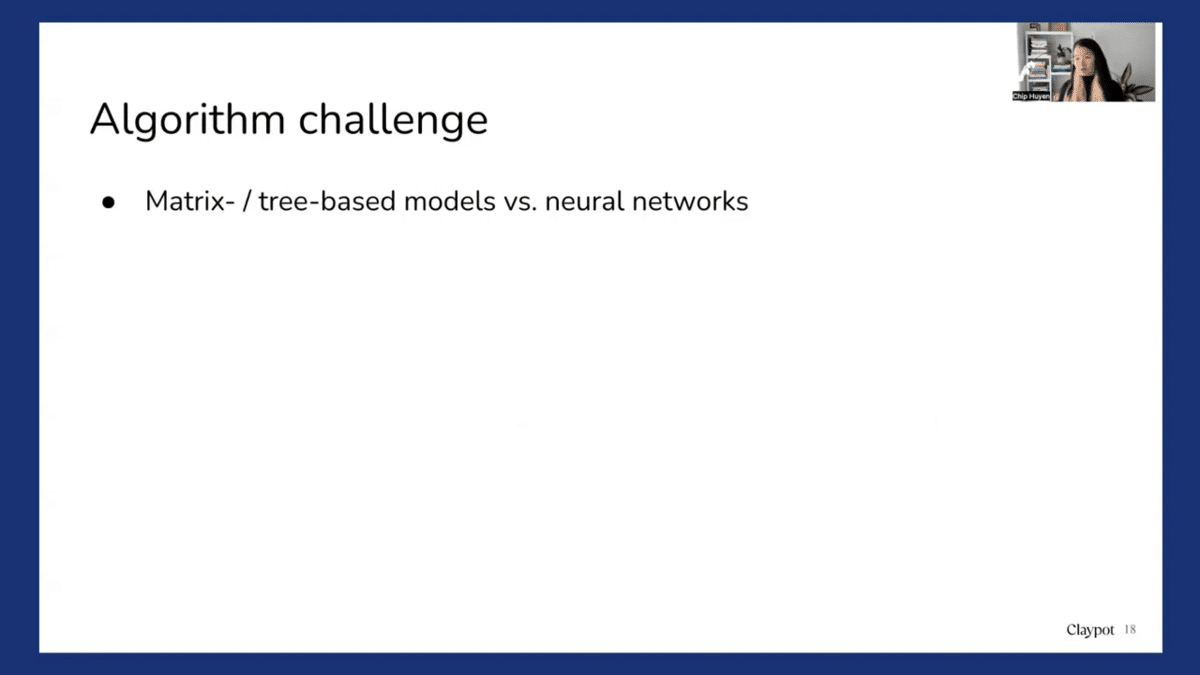
Another challenge is an algorithm challenge. So a lot of models can be updated using just a small set of data. For example, a neural network. You can update a neural network with just one sample, ten samples, or a hundred samples, and it works. However, for matrix-based models, for that to work, you will first need to construct the entire matrix of all the different data, and then you might want to apply some dimension reductions. And that process is very costly. You can’t do it very frequently, so you might want to construct a formation first before performing dimension reductions. However, I have seen some exciting research that has enabled matrix-based and tree-based models to incrementally learn.
Another challenge that is really difficult is the evaluation challenge. The more often we update a model, the more chances that model has to fail. So if we want to update the model fast, we need more people to evaluate that model update fast. This brings us to the next topic, monitoring.
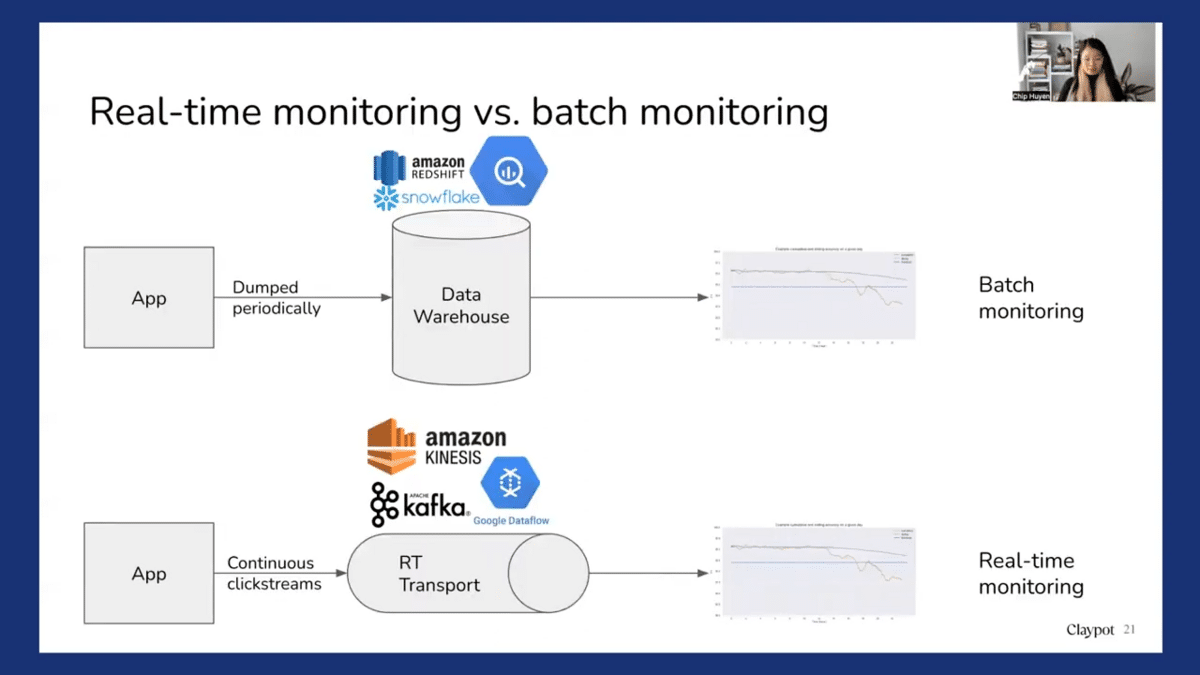
So there’s a world of difference between real-time monitoring and batch monitoring. And I see that a lot of monitoring solutions tend to conflate the two, especially the batch monitoring solutions. So batch monitoring solutions mean that you probably compute for metrics. What are the metrics you care about? Accuracy, patient distributions, and label distributions, computed from some historical data. So you might need to wait for the data to be dumped into the warehouse first, and then you run a script to compute these metrics maybe once a day. So that means that if we deploy the model today, you have to wait until the next batch of metrics is computed to get some sense of how the new model is doing. Real-time monitoring, in contrast, continually computes metrics from the data stream. So you might have been using something like Kafka or Kinesis to securely transport consumers’ click streams from the applications, and then using a stream processing engine to continually compute accuracy or predictions so that as soon as the model is deployed, as soon as there’s traffic coming in, you’ll be able to see how the model is performing.
So when we talk about monitoring, you might wonder what to monitor. What businesses really care about is business metrics like accuracy or click-through rate or purchase-through rate or the percentage of fraud being detected. However, this is not always possible because to be able to compute these metrics, we usually need to have user feedback or labels.
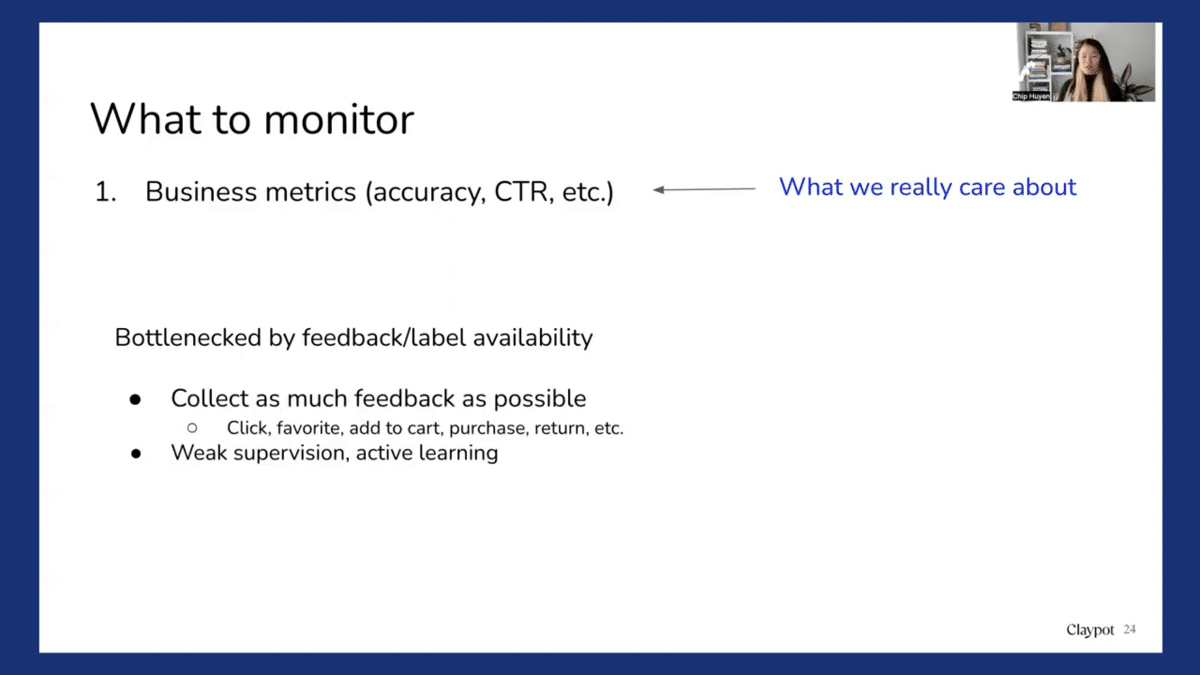
So one solution is that you might want to collect as much user feedback as possible. You probably saw recently that Netflix introduced a double thumbs-up icon. I’m not quite sure why they did it, but I would imagine that probably this type of double thumbs-up feedback allows the recommended systems to generate more relevant content for users. So for an e-commerce website, you might want to look at everything from click, favorite, add-to-cart, purchase, and return.
Different kinds of user feedback may have different implications. For example, clicks are very abundant. Users might click on a lot of things, but they have very weak signals. Clicking on something doesn’t mean that they’re going to buy it. Whereas buying a purchase is a lot less common, so users might buy an item very rarely, but that is a much stronger signal. Some companies optimize for click-through rates, some optimize for purchase-through rate, and what kind of user feedback works best for you really depends on the use case. So another solution is you might want to leverage solutions like weak supervision, like Snorkel, or active learning so that you can generate labels for the data faster.
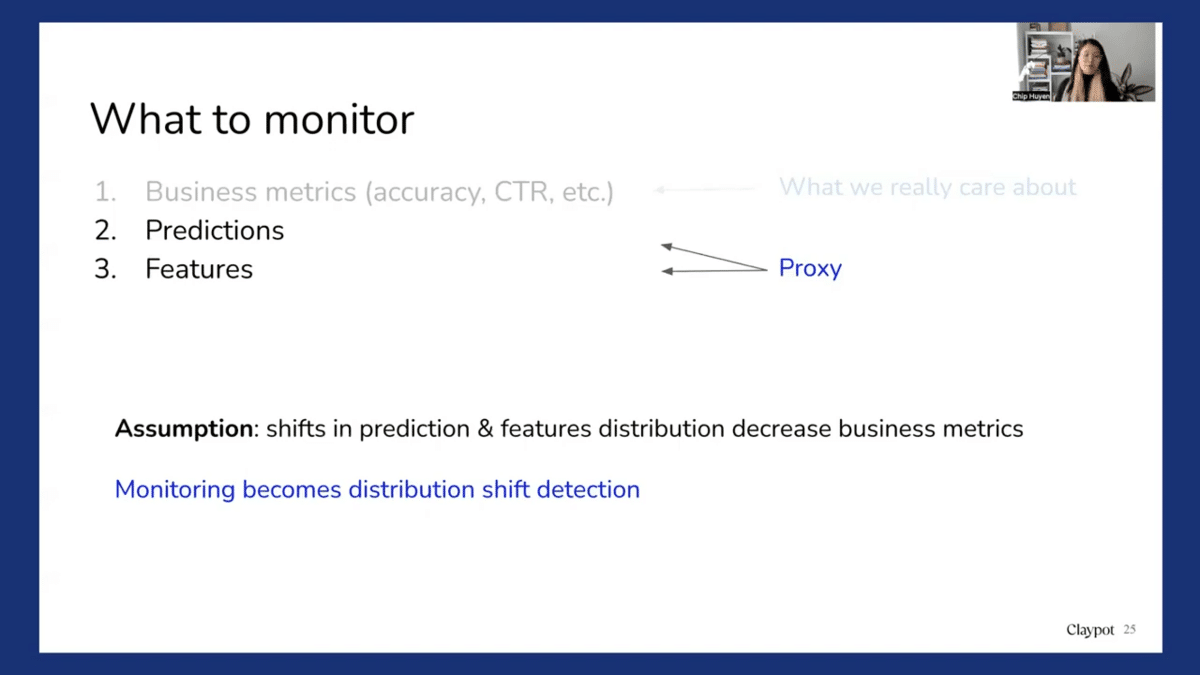
When we don’t have business metrics, companies look into predictions and feature monitoring. So the assumption is that a shift in predictions and feature distributions leads to a decrease in business metrics. So in that scenario, monitoring becomes a distribution shift detection problem. So how do you determine that two distributions are different? First, we need to detect distribution. We need to know our source distribution and our target distribution so that if a target distribution is different from the source distribution, then we can say that there is a distribution shift.
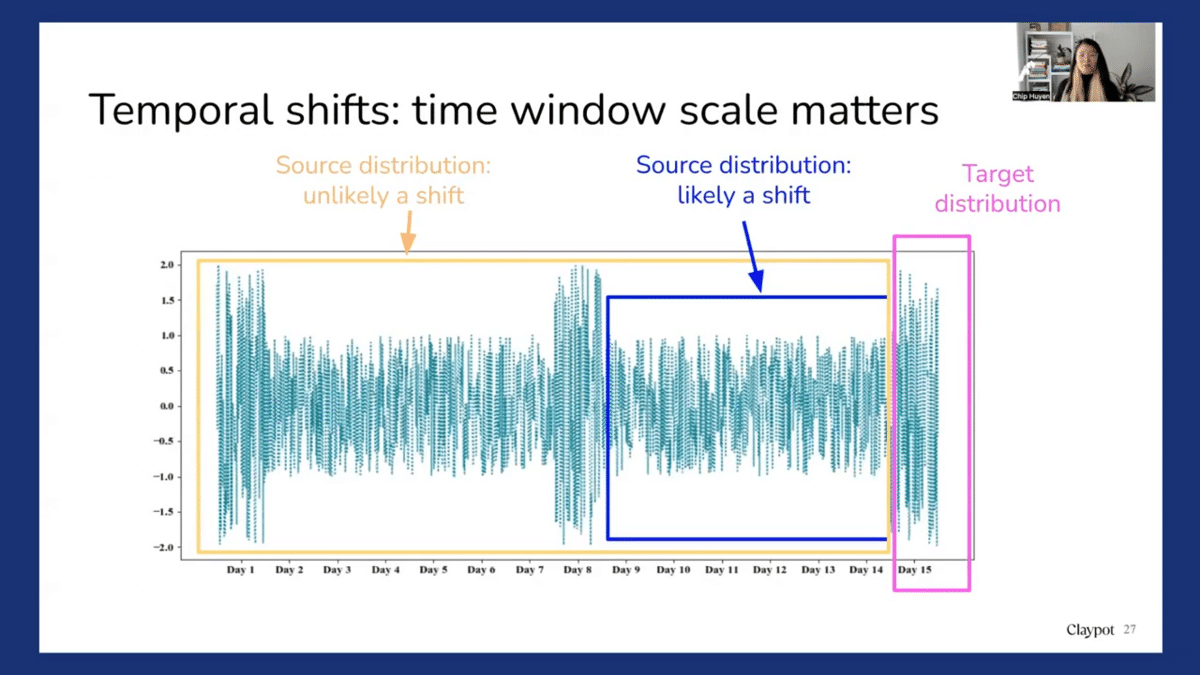
One of the very difficult types of shift to detect is the temporal shift, which is when data changes over time. And for this time window, scale really matters a lot. First of all, imagine we have a distribution like this, and imagine that today is Day 15 and we want to see whether on Day 15 there was some distribution shift.
So if you use Day 9 to Day 14 as a source distribution, then we say that Day 15 is very different from Day 9 to Day 14. So this period shifts. However, if you use Day 1 to Day 14 as a source distribution, you may see that the spike on Day 15 is actually expected, it’s very periodical. So this is not a distribution shift.
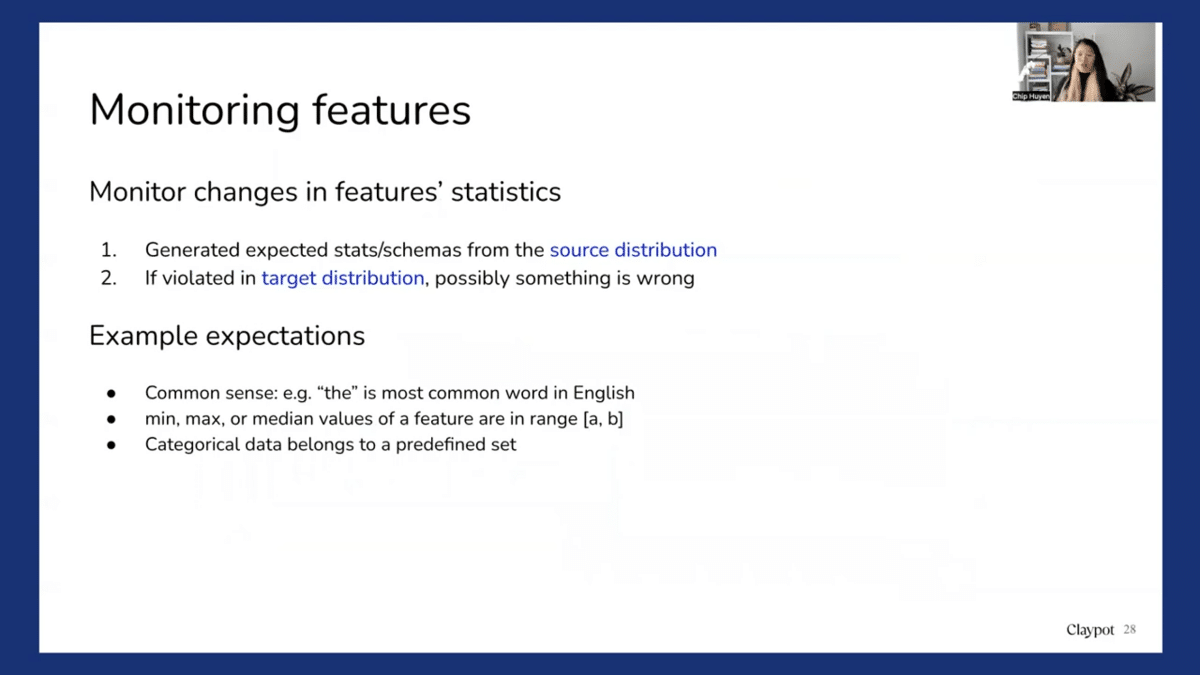
So we talk about monitoring features or predictions, and a lot of solutions today focus on monitoring features. With feature monitoring, usually people look into changes in feature statistics. So for example, during training, you migrate the means or the variance for a feature and then they store this means and variance. And during predictions, you also compute the mean and variance of the features. And then you compare these means and variances with the means and variances computed during training. And if they’re different, you say, “Oh, there’s a distribution shift.” So the means and variances are common metrics, but then they don’t have to use only means and variance, there can be other metrics. For example, if we know that “the” is the most common word in English and you’re doing NLP, so you want to monitor and count the number of “the” you encounter in production. And if “the” is no longer the most common word in production, then you might say, oh wait, something is happening.
This kind of monitoring is very inconclusive. Because if we see that the mean and variance are different, we may say that there has been a shift, but if they’re still the same, it’s not definite that there is no shift. There might still be a shift, but the statistics of expectations, of schemas we compute it as is not sufficient to take them.
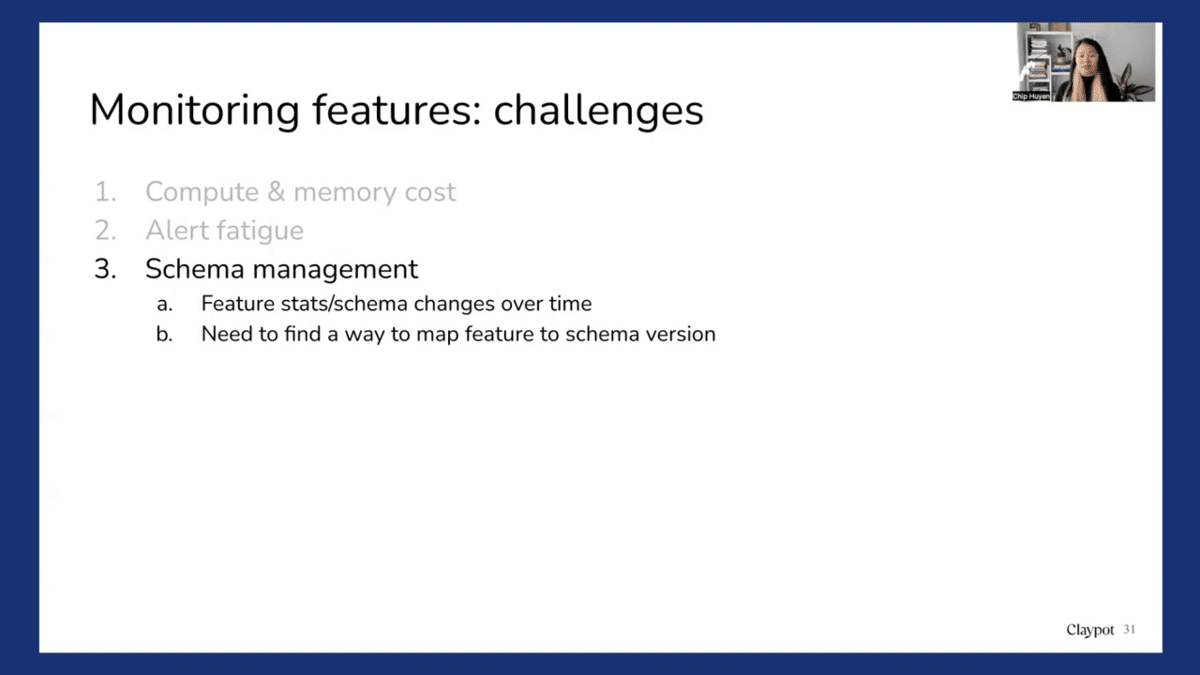
There are also other problems with monitoring features. The first is the compute and memory cost. A company doesn’t just have one model with ten features nowadays. We talk to a lot of companies that have hundreds of models and each model has thousands of features. So imagine, just continually computing statistics for tens or hundreds of thousands of features can be very costly. And also, when we have so many features, it’s very likely that some of them change from time to time. So if you have ten thousand features, it’s very likely that maybe ten of them change a day. So it’s enough to have alert fatigue because most of these changes in the statistics of the features actually are not important; they don’t really do anything in the model. So if you keep alerting the developer or data scientist every time there’s a change, over time, they get sick of all the alerts because many of them are false alarms. And also since we compute the statistics, the statistics might change over time. So we initially want to figure out a way to manage all these expectations for these statistics. So we know this by knowing the expected statistics for the model because you might change the features from time to time.
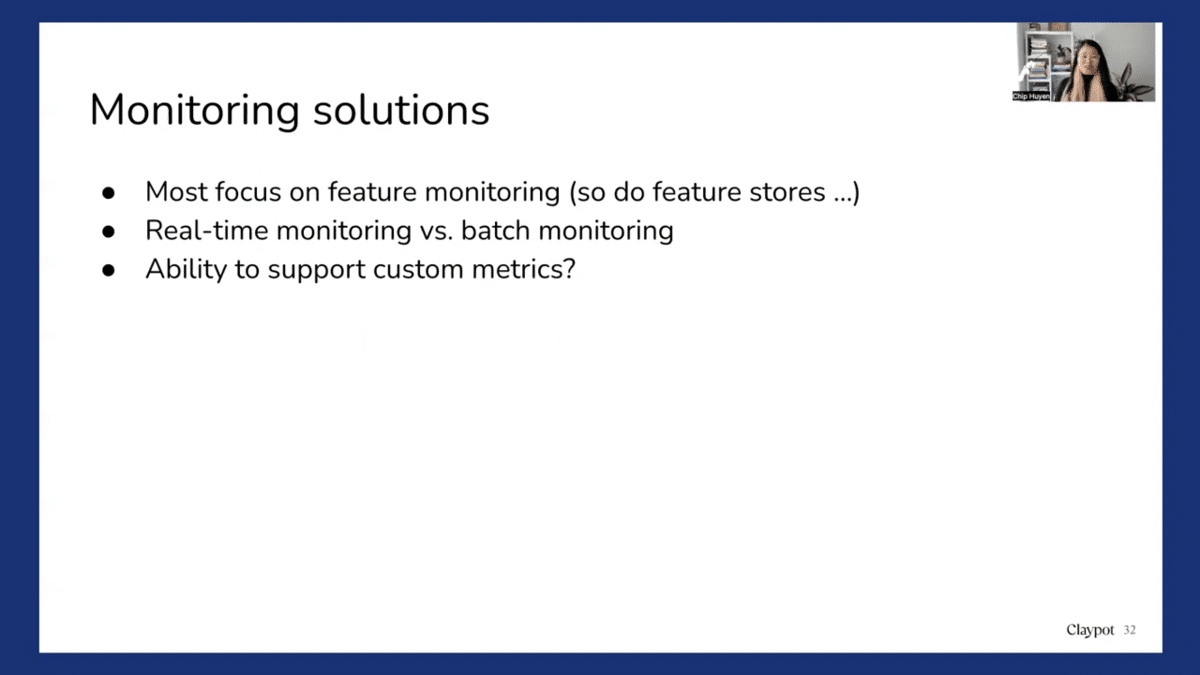
Unfortunately, most monitoring solutions today are still more focused on feature monitoring and so do feature stores because feature stores have computed features, so it’s predictable that they monitor features for you. If you want to look into monitoring solutions, you might want to look into whether they do both real-time and batch monitoring. A very important thing that we have seen that makes a lot of companies not use a monitoring solution is when the solution doesn’t support custom metrics. One thing I learned is that every company cares about different things. Some care about accuracy, some care about precision, some care about top-three accuracy. Some care about some fancy metric like NDCG or some diversity metric. So to look into monitoring solutions, we really need to look into whether that solution can support your metrics.
So yes, that is my talk. My time is up. Thank you so much for having me. And here’s my email. Here’s my Twitter. Please reach out if you have any questions. And also, I’ve just had a book come out as well, so if you’re interested in the topic, please check it out. Thank you so much and have a nice day.
Catch the sessions you missed!
The Future of Data-Centric AI 2023, our two-day free virtual conference, brought together thousands of data scientists, AI/ML practitioners, researchers, and the AI community at large to hear about and discuss the latest trends and research in data-centric AI. If you registered for the event but didn't see all the sessions you wanted, you can now catch up. The recorded sessions are available for registrants at the same Zoom portal as the live sessions.

Recommended articles
View all articles

Agentic AI evaluation: Closing the gap with better benchmarks and data
Alex Ratner, co-founder and CEO of Snorkel AI, spoke at @Scale: Systems & Reliability about one of the most underappreciated problems in AI deployment: our ability to measure agents has been outpaced — arguably for the first time in the history of the field — by our ability to build them. The talk digs into what it actually takes to close that
June 23, 2026
•
Snorkel Team

JudgmentBench: Comparing Rubric and Preference Evaluation for Quality Assessment
At our latest Snorkel AI Reading Group, Russell Yang (AI Engineering Fellow at Stanford Law) stopped by our San Francisco office to present JudgmentBench: Comparing Rubric and Preference Evaluation for Quality Assessment. As AI models improve at open-ended tasks, the field faces a harder problem: how to measure quality in domains where ground truth is contested. Two paradigms dominate: rubric-based
June 18, 2026
•
Snorkel Team

The Art and Science of Building AI Benchmarks That Shape the Field
Vincent Sunn Chen spoke at AI Engineer London about what it actually takes to build AI benchmarks that move the field forward, not just measure it. The throughline is an asymmetry that keeps showing up across deployments and the 150+ proposals reviewed for the Open Benchmarks Grants: agent capabilities are climbing fast, but the ability to measure those agents with
June 16, 2026
•
Snorkel Team

