Jason Goldfarb, senior data scientist at State Farm, gave a presentation entitled “Reusable Data Cleaning Pipelines in Python” at Snorkel AI’s Future of Data-Centric AI virtual conference in August 2022. The following is a transcript of his presentation, edited lightly for readability.
It has always amazed me how much time the data cleaning portion of my job takes to complete. So today I’m going to talk about an approach I often use to help remedy the time burden: reusable data cleaning pipelines.
As the algorithms we use have gotten more robust and we have increased our compute power through new technologies, we haven’t made nearly as much progress on the data part of our jobs. Because of this, I’m always looking for ways to automate and improve our data pipelines. Data cleaning pipelines reduce the amount of time it takes to clean your data and can be shared and reused for different data science projects.
During today’s presentation, I will discuss a few of the benefits and limitations of using data-cleaning pipelines. More specifically, I’m going to discuss using Scikit-Learn pipelines within Python. I will also demonstrate how Scikit-Learn classes can be consumed within your data-cleaning pipeline, and we’ll walk through a basic exhibit of how it works using a few of the columns from the Titanic dataset.
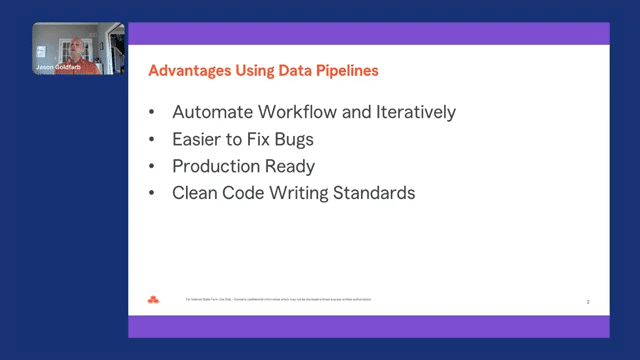
So why should we use data pipelines? The most common reason is that data pipelines provide a process to transform data in an automated manner. In addition, steps in the data pipeline can be changed or extended by adding additional steps. For example, let’s say you realize during your initial data exploration a few columns in your dataset only have single values. You can add a check to your current data pipeline that drops any single value columns from consideration. The remaining bullets are related to using code as a service and can be leveraged within a common repository so code can be shared across your team. For example, your team could create a repository where data scientists, machine learning engineers, and other associates interested in data science work can share, contribute, and consume Python classes and functions within their model build process.
It is recommended that you agree upon standards and best practices contributors must meet before their code can be pushed to the repository. In addition, code contributed to the repository should also follow some Python style guidelines and have unit testing to ensure the desired functionality is achieved.
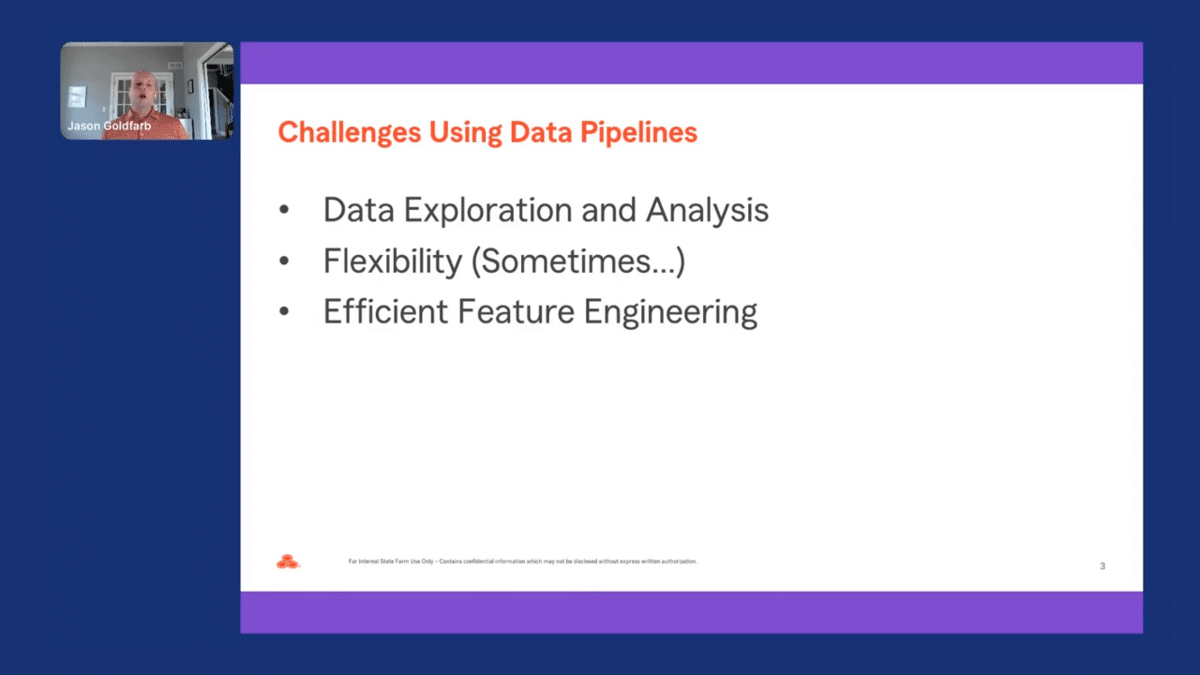
While there are a lot of benefits to using data pipelines, they’re not without limitations. Traditional exploratory data analysis is difficult to accomplish using pipelines given that the data transformations achieved at each step are overwritten by the proceeding step in the pipeline. You could, however, run some exploratory data analysis on the raw data, and then run the same analysis on the transformed data to observe how the data has changed and assess if the pipeline meets your needs before moving on with your analysis.
Also, when creating your pipeline, you need to determine the set of pipeline steps for each data type in your dataset. This causes the process to be rigid since you cannot transform a subset of features one way and another subset of the features a different way. Doing so would take some customization and might only work for the current dataset you are using.
Similarly, to test out different feature engineering processes you would need to develop and run different pipelines. This cannot be accomplished easily with a single pipeline and may take running many different pipelines using different classes before achieving your desired results.
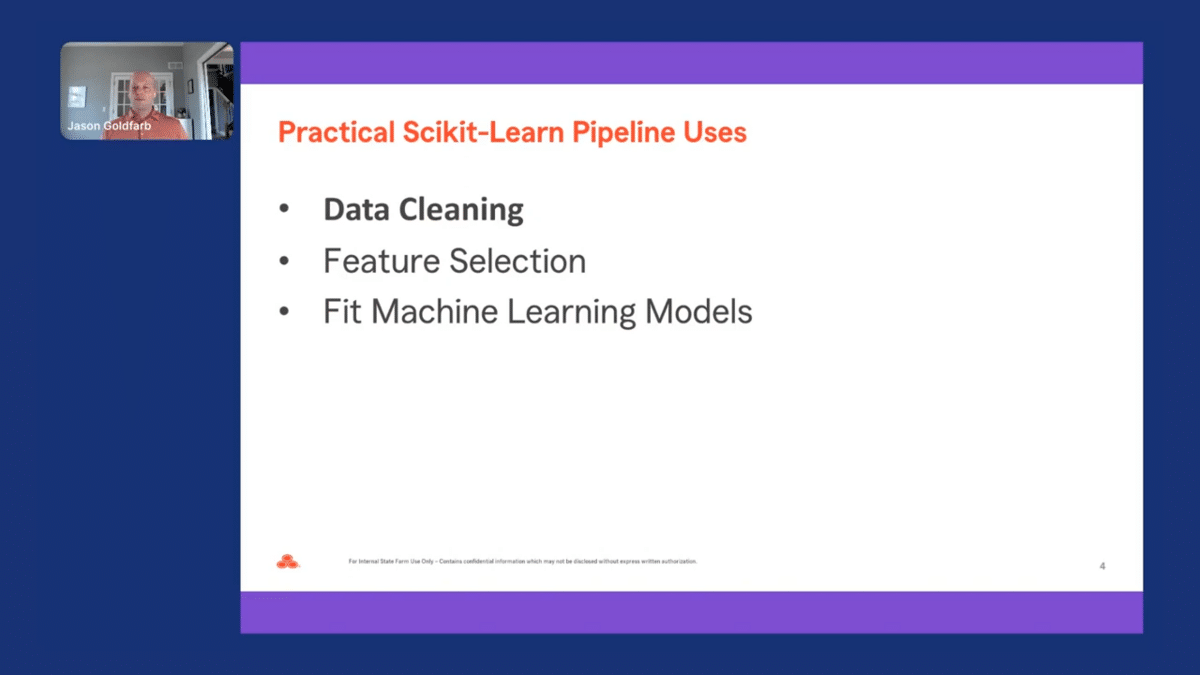
While I will only cover using Scikit-Learn pipelines for the data cleaning process, these pipelines can be extended by including extra steps to your pipeline. These steps could include doing feature selection on your data or fitting a machine learning model. For example, you could create a feature selection class that calculates the variable importance for a generic random forest model on your training data and only keep the features with a feature importance value above a certain threshold after the data cleaning step. Additionally, you could then fit a logistic regression model on those selected features.
In Scikit-Learn, transformers are objects that transform a dataset into a new one to prepare the dataset for predictive modeling. Some examples include scaling numeric values and one hot encoding categorical features. Scikit-Learn has many transformers and often it is helpful to wrap base transformers or even create your own class to attain results for a desired task.
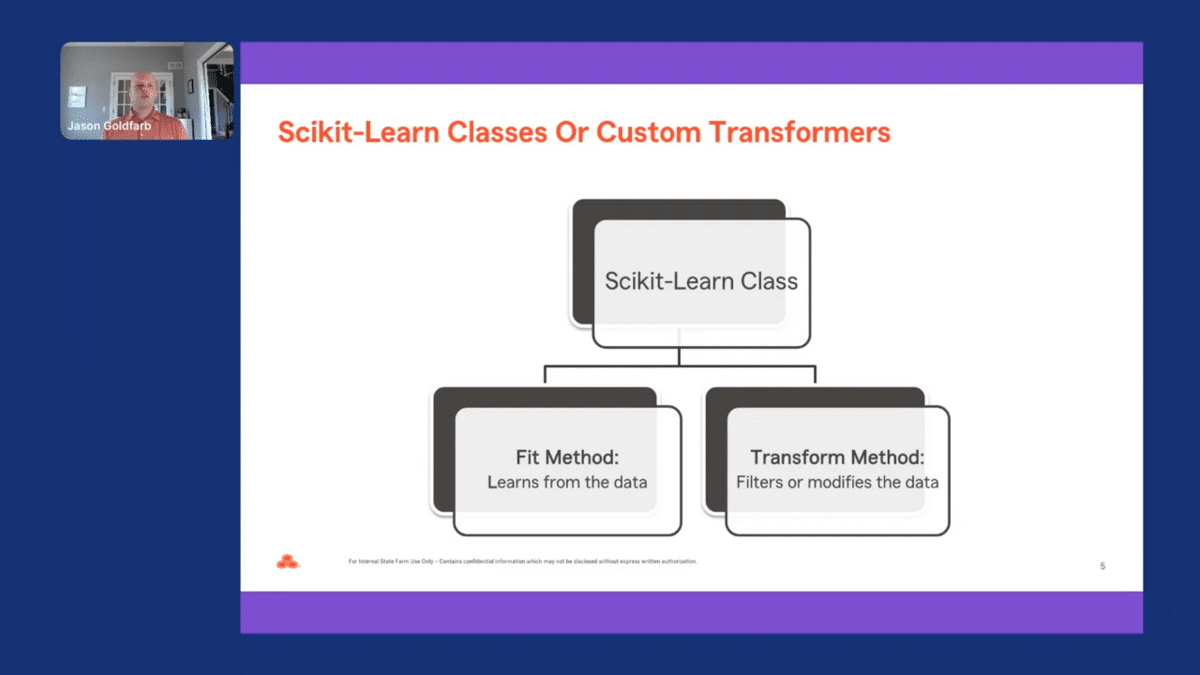
When creating a class, there are two methods you need to define, which are the fit and transform methods. The fit method is used to learn from the data, and the transform method is used to filter or modify the data. These methods need to have both an X-matrix and Y-vector parameters. And the transform method should return a Pandas DataFrame or NumPy array to ensure that the data created is compatible with pipelines.
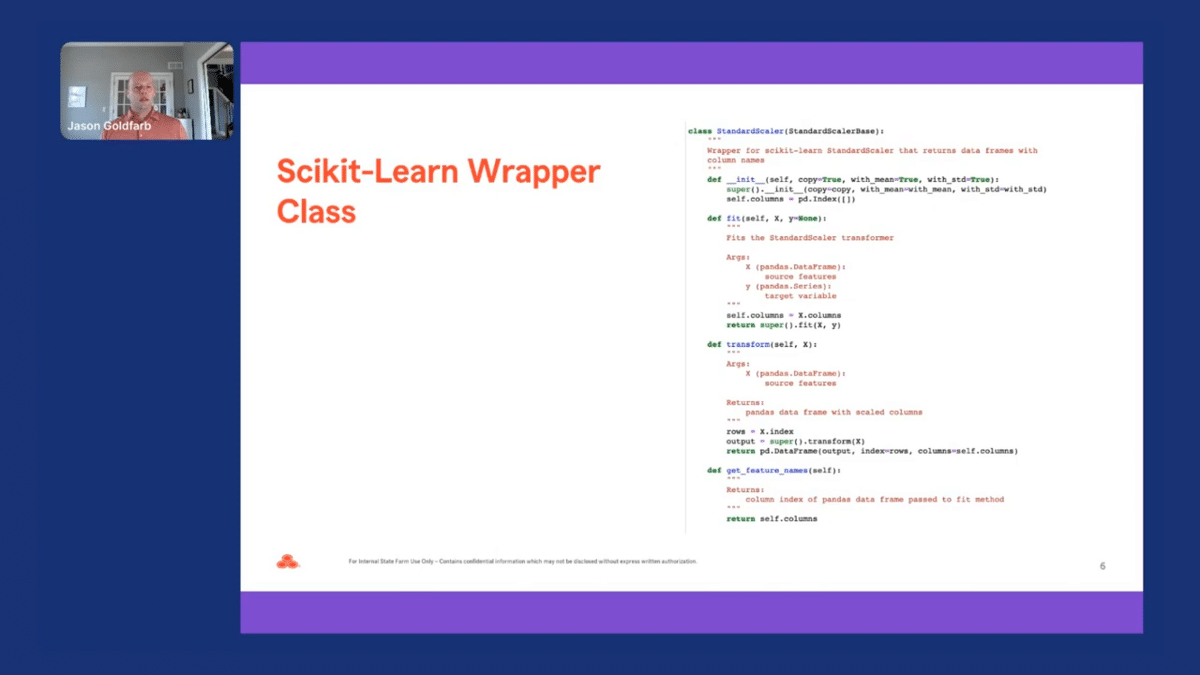
To see how this works, let’s create a class that uses a standard scaler to transform all our continuous columns in our dataset. Looking at the code on the right, we can create a class that inherits the StandardScaler base class from Scikit-Learn and return a dataframe that scales our continuous columns.
The fit and transform method inherits the StandardScaler functionality, and then a dataframe is returned with the scaled columns. You would follow a similar process if you wanted to create a wrapper class that inherited the base Scikit-Learn classes for doing one-hot encoding or using simple imputing for both your continuous or categorical columns.
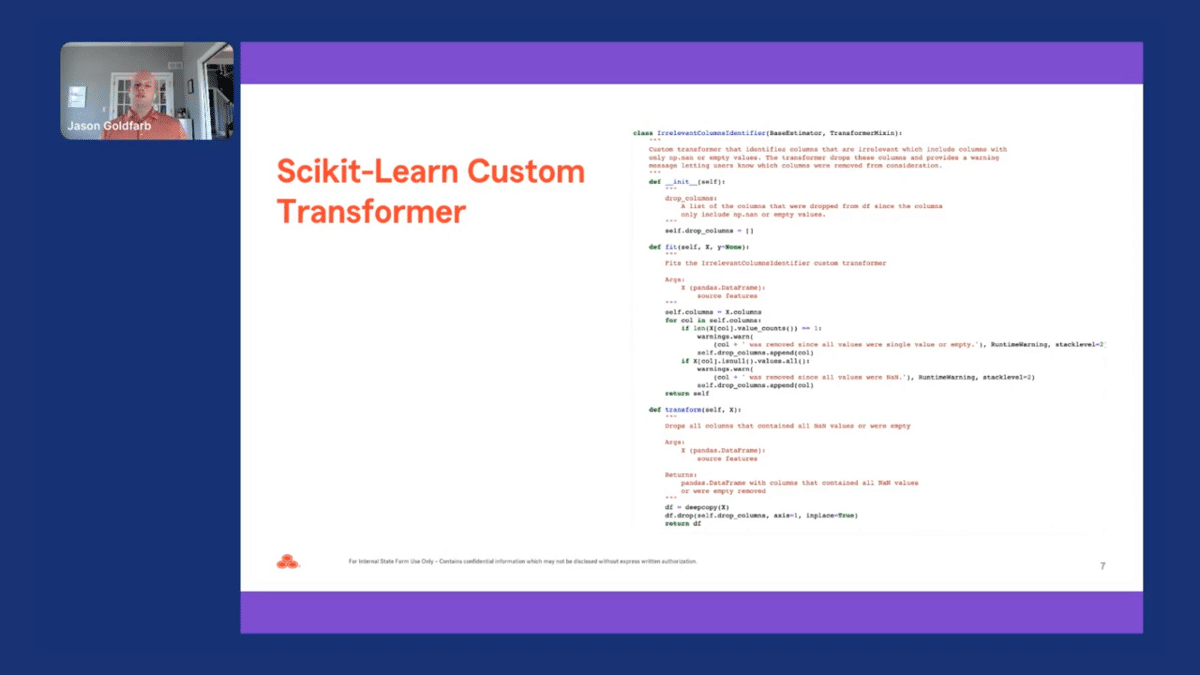
You could also create your own custom transformers by changing the inherited class to BaseEstimator and TransformMixin classes instead of using the base Scikit-Learn class, which was accomplished with the example code on the right. Let’s go back to our example of creating a class that drops a single value column from our dataframe before doing imputation or performing other data cleaning methods.
We would first develop our fit method to learn or identify which columns are single-value and add those column names to our drop column list set at the top of our code. Our first “if” statement in our code identifies all the single-value columns. Our second “if” statement identifies all the columns with only the NaN values. We then take these columns added to the drop list and then pass that to our transformer. And in the transform method, those data columns are then dropped from our dataframe, only keeping the columns that have more than just a single value.
Next, I will demonstrate how our example code works on a few of the columns from the open-source Titanic data. First, I will show how you can use a few of the classes to transform the continuous columns from the dataset. Second, I will demonstrate how it works on our categorical data. This functionality can be extended by creating steps and pipelines to transform date or text variables. However, we don’t have the time today to go over how that works.
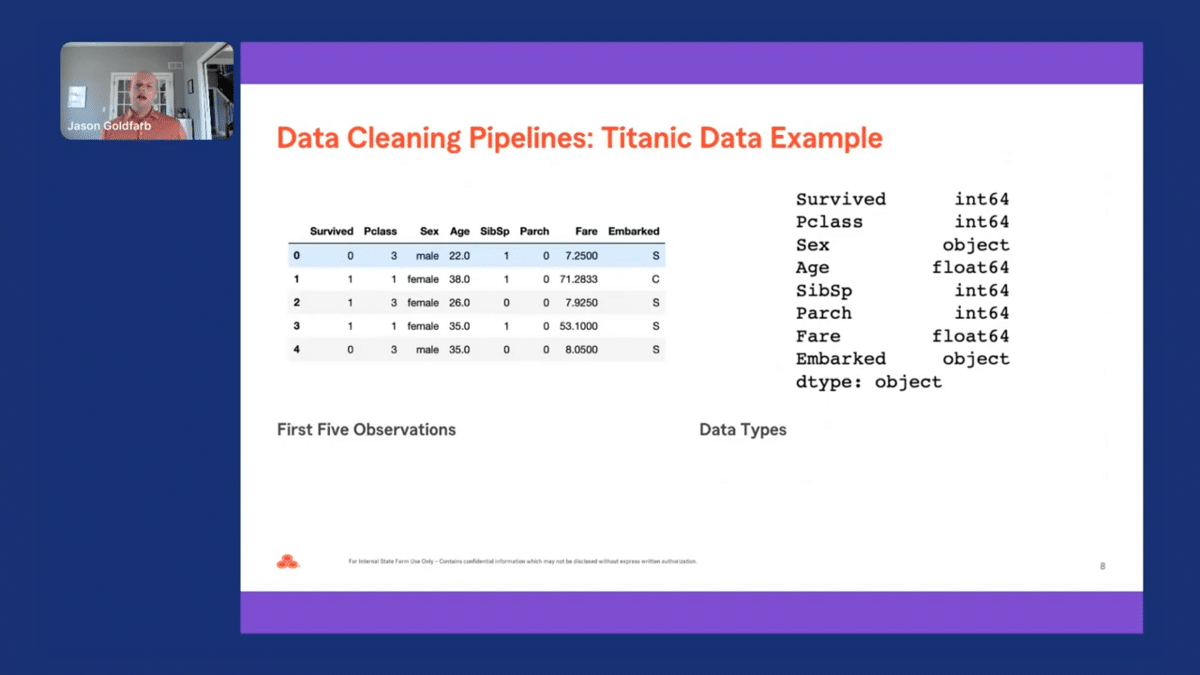
Let’s first look at our data before we start the data cleaning process. Provided on the screen are a few observations from our data and the data types for each of the columns. As we can see, “survive” is our target variable and is a binary variable with only values of zero and one. Looking at the rest of the data, there are two continuous columns–age and fare–and the other five columns are categorical.
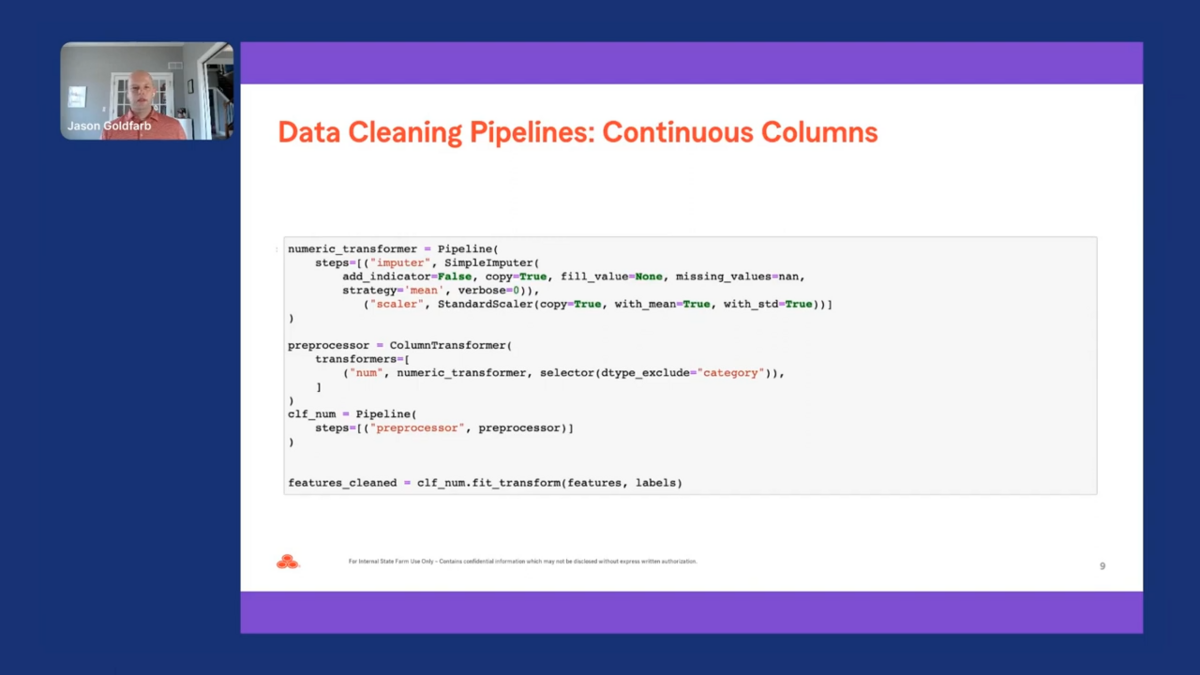
To set up our pipeline, we need to pass our pre-processing steps to the column transformer. Within the column transformer, we use an optional parameter selector to exclude or include any categorical columns from being processed within the pipeline. We then need to fit and transform our data to return a dataframe that was transformed using our pipeline.
Our continuous pipeline has two steps, the first being imputing all the NaN values with the mean value for each column. The second step leverages the standard scaler class we previously looked at and scales all our continuous features. On the last line of code, we then pass the fit transform method on our feature dataframe and labels or target Pandas series. Returned is a dataframe for features that has been transformed by our pipeline.
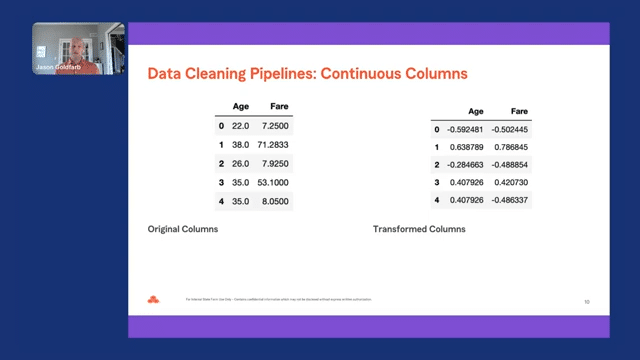
We can now compare the two continuous columns that we passed through our pipeline. As mentioned before, exploratory data analysis can be accomplished on the original and transformed data to better understand the transformations made to the data. Looking at the first few observations in the original and transformed datasets, we can see the values for age and fare have changed significantly. Both the values for age and fare were scaled using the standard scaler to transform the distribution to be roughly normal.
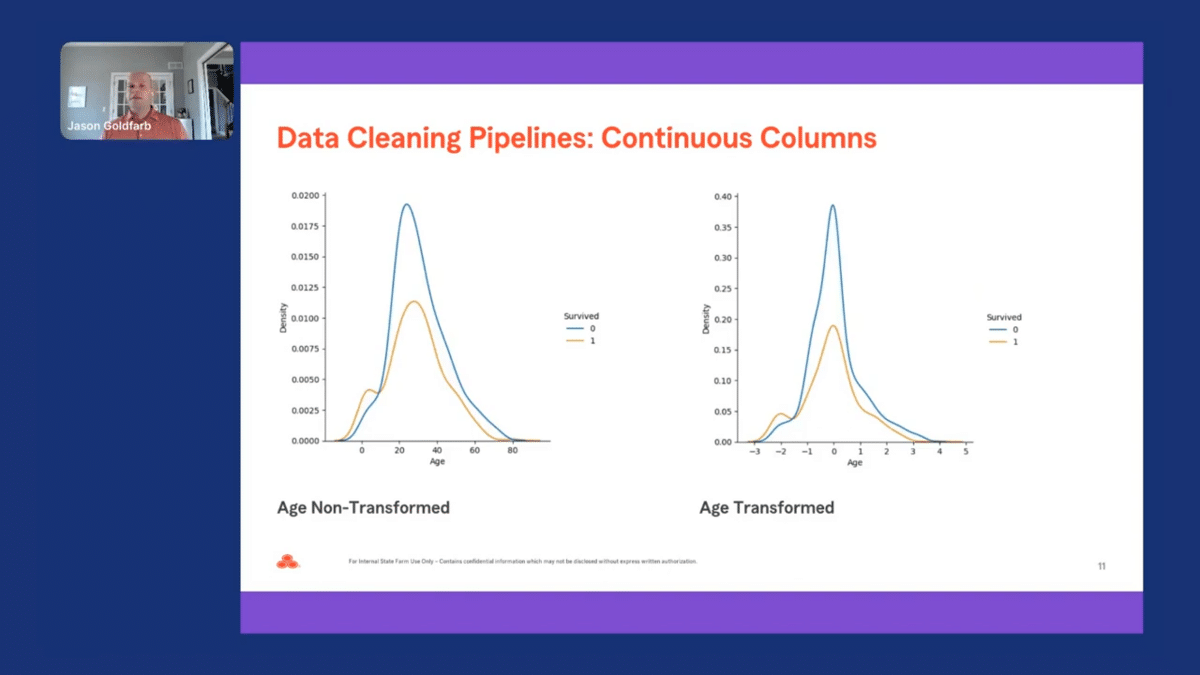
Let’s continue our analysis by examining the distribution for continuous columns. The distribution for the non-transformed age variable looks to be fairly normal and did not significantly change the distribution after being transformed. As mentioned before, one of the limitations of using data cleaning pipelines is that all the columns are transformed the same way, given the column data type.
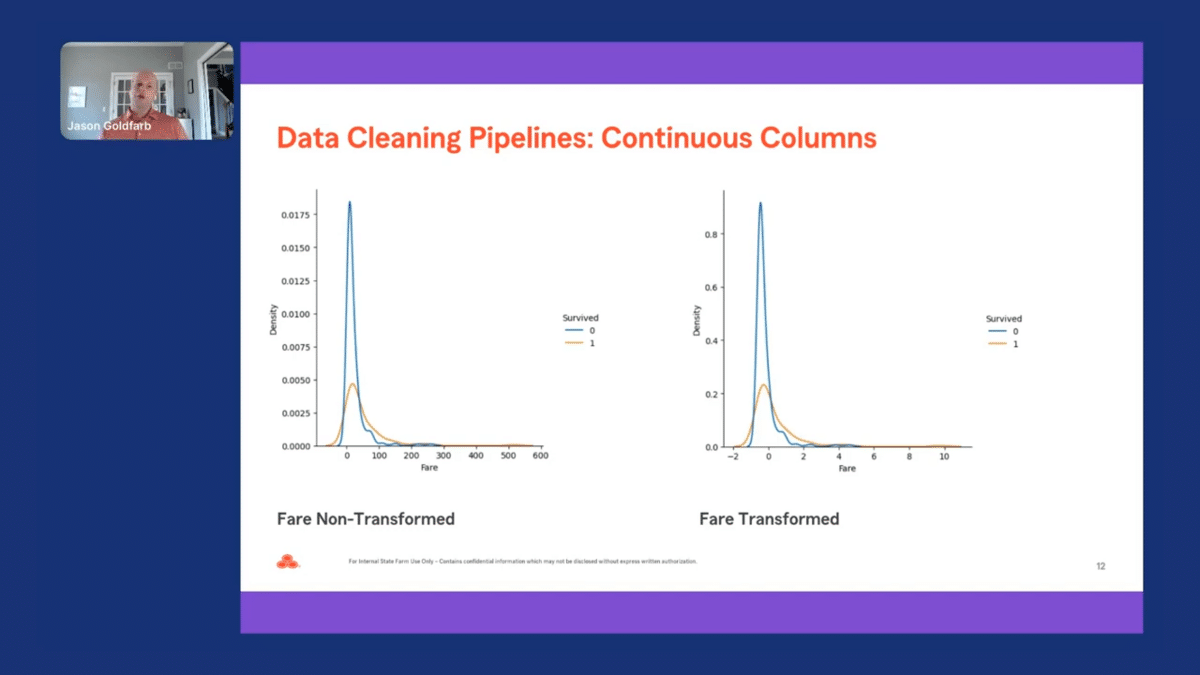
The distribution for fare for the non-transformed variable appears to be fairly long-tailed, and the scaled version doesn’t appear to significantly change the distribution for the original variable. While we won’t be able to cover it during this presentation, we could have updated our pipeline for our continuous columns using another transformer. We could then compare the results to see which transformer worked the best for a given dataset.
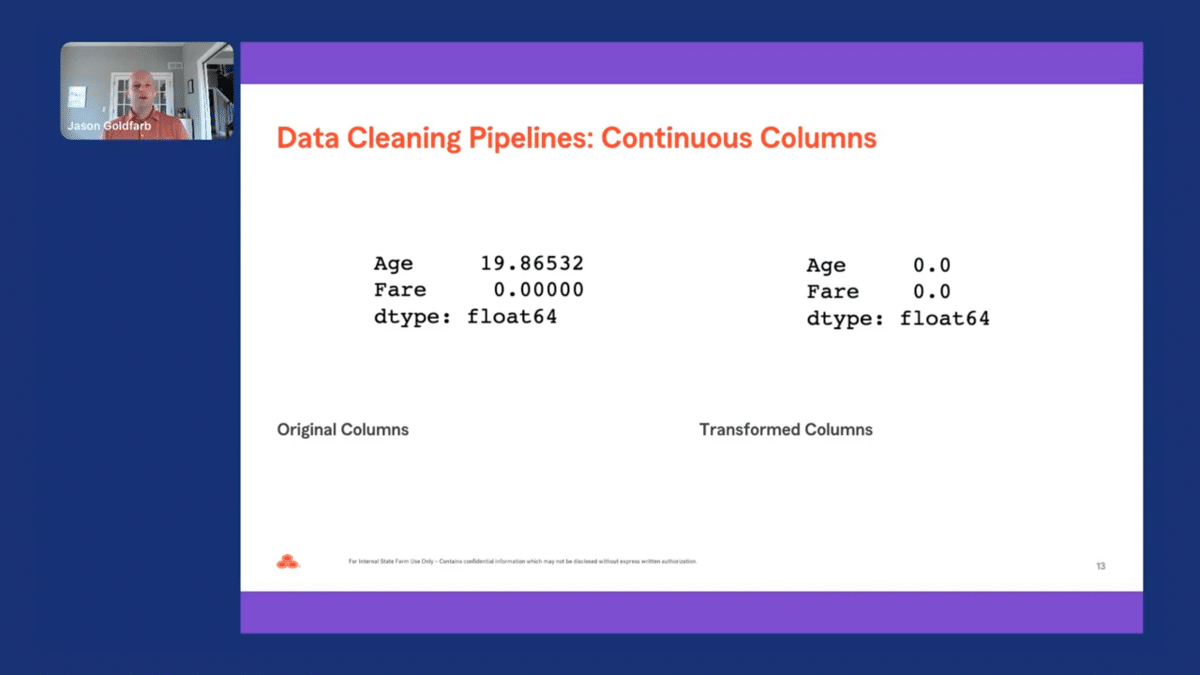
Lastly, I did a reasonableness check to see if there were any NaN values. As we can see in the two tables, all the missing values for age were imputed, and in the end, there were no NaN values represented in the data.
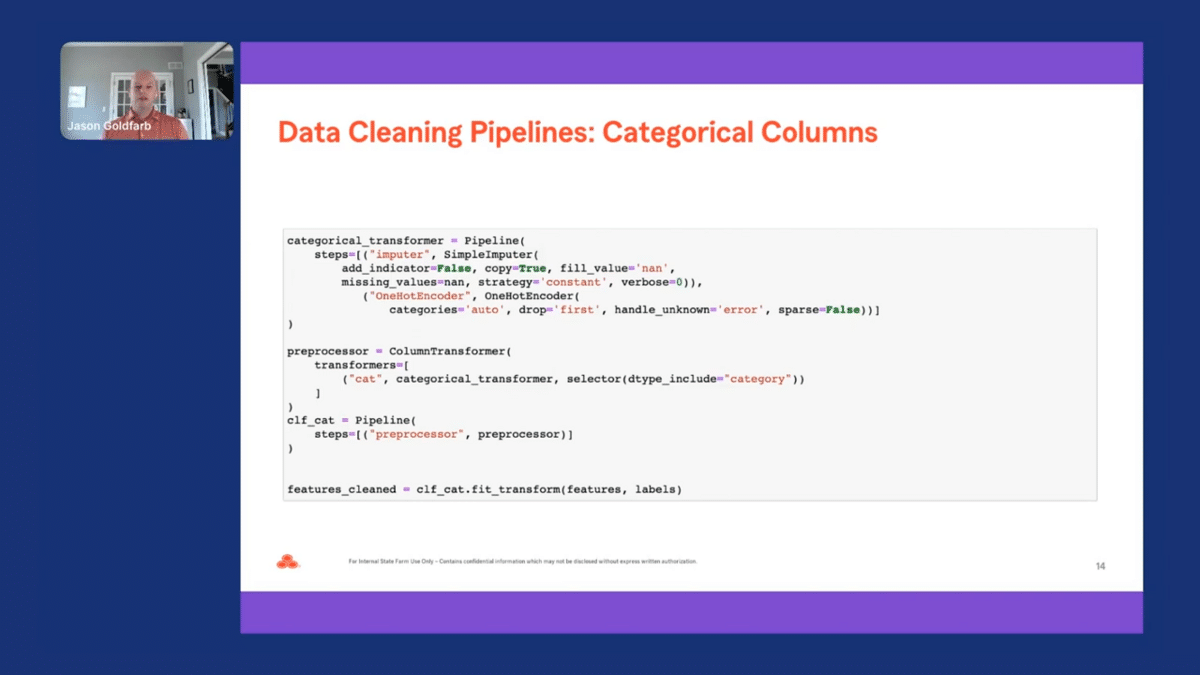
Our categorical pipeline also has two steps. The first step imputes any missing values with NaN. The second step takes all the categorical values and one-hot encodes them and drops the first column. Just as a reminder, one-hot encoding, converts a categorical variable into a series of dummy variables. Again, we then pass the fit transform method on our feature dataframe and labels or target Pandas series. Returned is a dataframe for our features that has been transformed by our categorical pipeline.
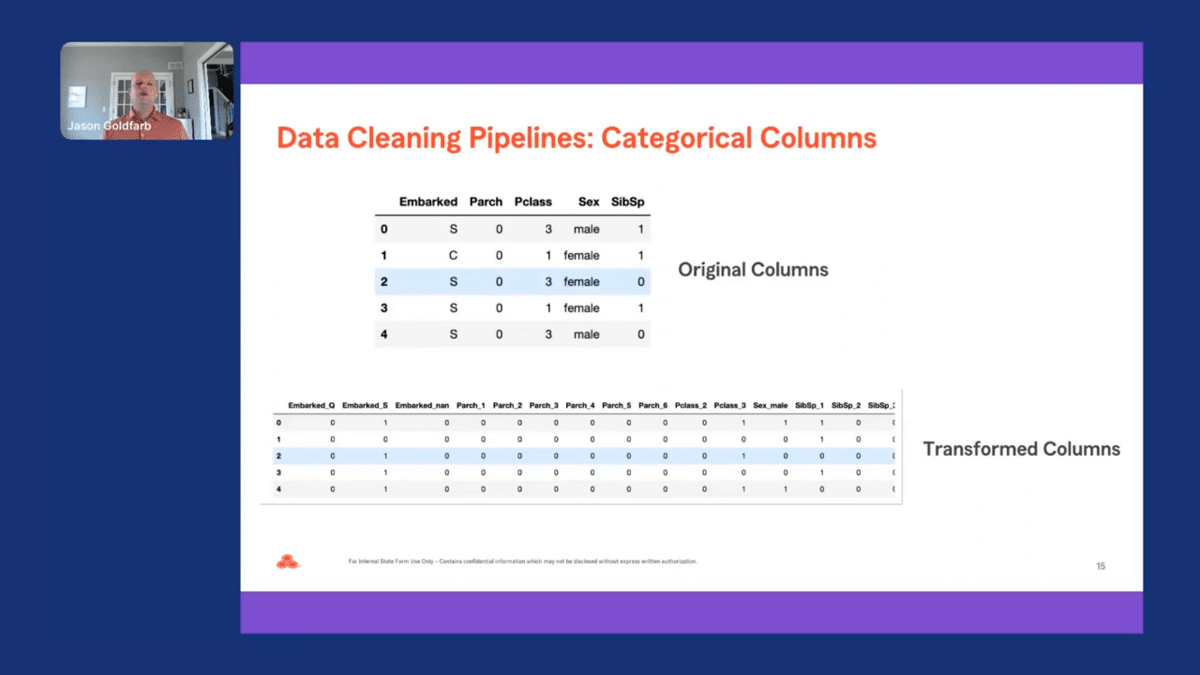
We can now compare the five categorical columns by looking at the head for the original and transformed data. There are a lot more columns in the transformed data since the pipeline creates a new column for every level besides the first one for each categorical column.
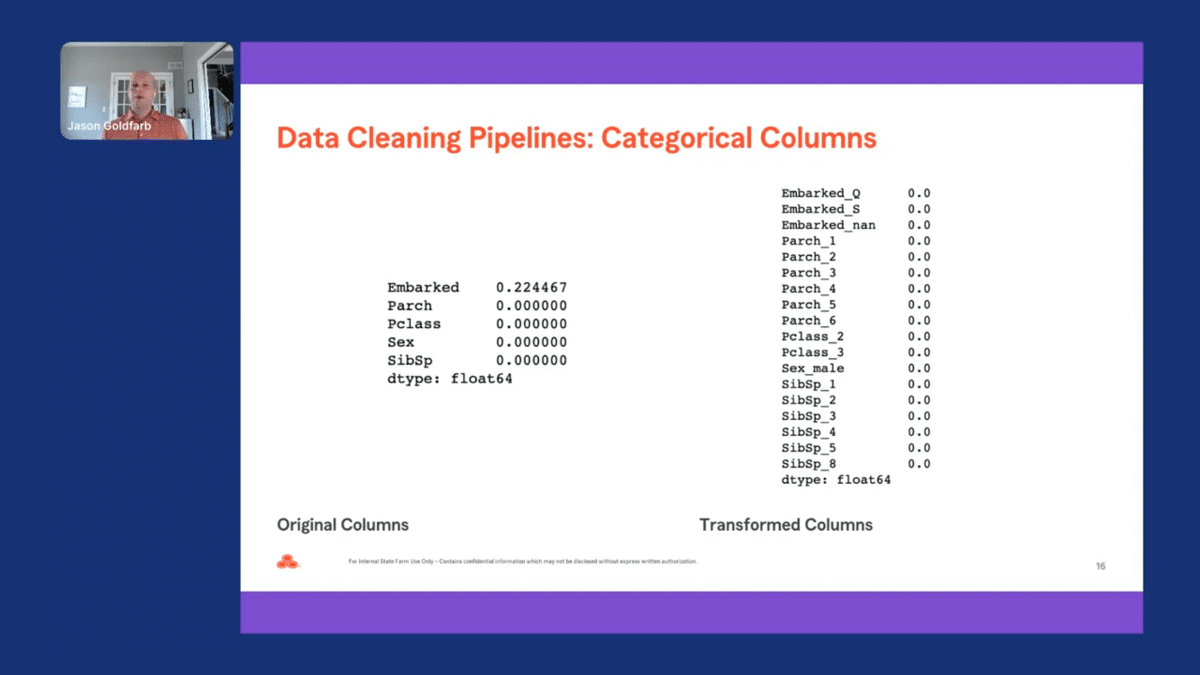
I also looked at the “missing” list for the categorical columns. We can see there are no NaN values present in the transformed data. In addition, a column was added to our transformed data for the missing observations for “embarked.”
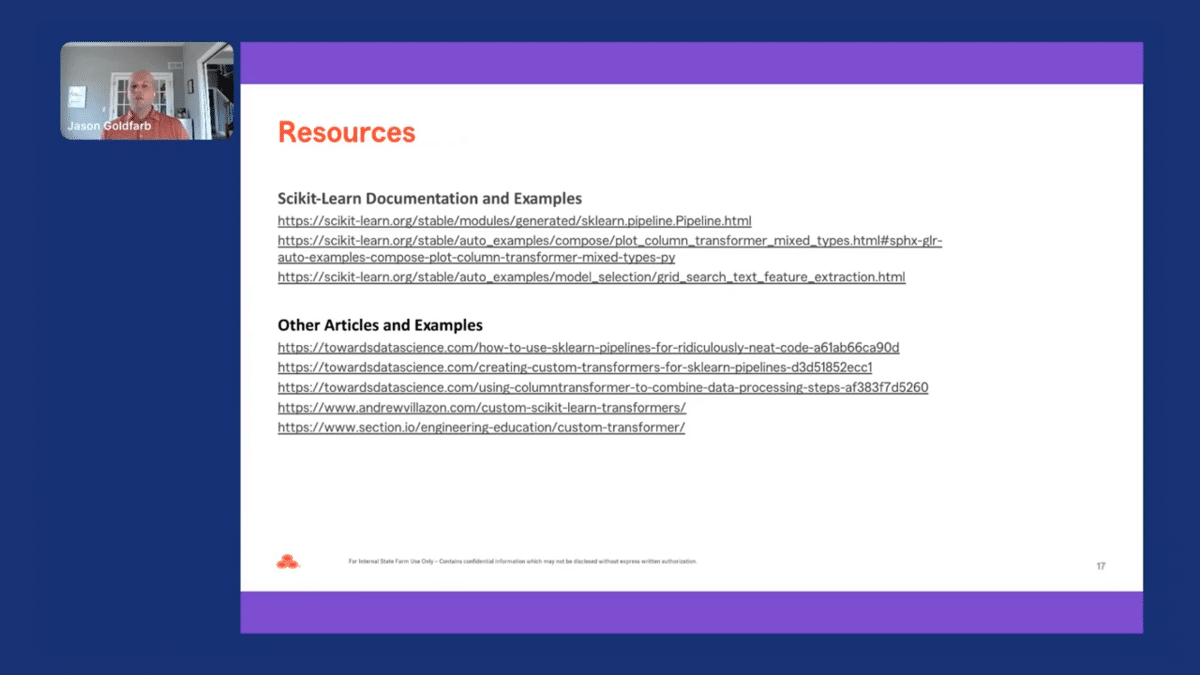
There are a lot of great resources out there on Scikit-Learn pipelines. However, here are some of the resources you may consider using when playing around with Scikit-Learn pipelines within your own work. The first set of links comes from the Scikit-Learn documentation. The last set of links are articles using Scikit-Learn pipelines on toy data, or creating custom Scikit-Learn transformers.
Now you are ready to start using reusable data cleaning pipelines using Scikit-Learn in your everyday work to save time and increase the automation of your data pipelines. I hope you enjoyed the material I presented today, and I’m happy to answer any questions you might have.
Scikit-learn data cleaning pipelines Q&A
Aarti Bagul: Amazing. Thank you so much, Jason, for that wonderful talk. We will be doing a Q&A at this point. So audience members, if you do have questions that pop up, please add them to the Q&A tab and we’ll take those as well. So Jason, thanks again. Just to start off with a very high-level question. I know you mentioned some techniques that you use and how you set up these pipelines, but could you give the audience a sense of some machine learning problems or applications of machine learning that you are seeing at State Farm that are particularly impactful?
Jason Goldfarb: Yeah, that’s a great question. So oftentimes we’ve used these pipelines to handle model-building projects where we’re thinking about solutions for binary target models, so values of zero/one or regression problems. So it’s fairly easy to set up the data cleaning pipeline to transform and clean your data, but then as I mentioned, you can actually extend these pipelines to doing some feature selection. So you can actually remove some of the columns that are not as informative as others to get down to a subset of columns and build a model that’s a little bit parsimonious than fitting one on all the features available in your dataset.
AB: That makes sense. So like extending these pipelines–I guess my question was also more around, what are the business applications of machine learning that you are finding exciting in terms of just problems you’re seeing?
JG: Oh, that’s fair. Good question. So honestly, before moving into my data scientist role, I was on the model validation team. Oftentimes we had to build challenging error models or alternative models to a lot of the models that are being built across the industry. So we’ve used reusable code with marketing, building on claims models, and sometimes validating underwriting or pricing models. So this functionality can actually be extended across a lot of different industries and isn’t really focused on one over another.
AB: Makes sense. We have a question from John who asks “Is it possible to do this type of data cleaning pipelines in R or Julia?”
JG: I have not actually been able to test that out. That would be an interesting extension and I would love to actually play with that. I’ve mostly focused my work on Python, but no, good question.
AB: Makes sense. I think people tend to pick their languages and then stay with them. Python’s definitely the most popular. So I’ve used Julia for a class at Stanford, but otherwise–
JG: Oh, that’s awesome. So we started off using Stata at State Farm. I jumped into R and then I did Python, but like this pipeline thing, I didn’t get into until I started doing it now.
AB: So you talked about this pipeline, which is, the feature engineering and you talked about extending it to the model training part as well, just in terms of building the end-to-end machine learning application that a business would use, where are you seeing yourself spending the most time now that you have this pipeline to do this part, especially?
JG: Yeah, so now it’s mostly trying to identify the features that are the most useful to the model, and then trying to identify the transformations that actually work the best for your model. So oftentimes I’ll build a quick pipeline. You use these very–I don’t want to call them generic feature transformations, but honestly, ones that are easily performed on a lot of different types of data. And then I’ll go in and look at the individual relationship between the predictor and the target and just see which ones fit the data the best.
AB: Makes sense. And this feature engineering part that you’re doing, is that just more from the data scientist or subject matter expert? How does that back and forth look, in terms of the feature engineering itself, what features to pick, et cetera?
JG: Oftentimes we’ll build an initial model, but then we’ll actually have to then reach out and talk to our business partners because they’re the subject matter experts. And so in the end, whatever we’re fitting needs to meet their needs. And sometimes what’s nice about having a reusable pipeline that way is, let’s say a feature gets removed from your process, and it may be the most predictive one that’s actually available in your subset, right? You could easily go back to your original dataset, remove that feature, then run the process again. And so you haven’t really lost as much time as a more manual process would have.
AB: And just in terms of iterating on these features, the whole pipeline, what are your best practices in terms of debugging these pipelines?
JG: That’s a good question. So I think the best practice would be able to have some type of repository where you have unit tests for each of the classes or functions that you’re using within your pipeline. So let’s say you have a correlated column remover class where you’re trying to remove the first column of two matching columns that are highly correlated with one another. To do that, you would just create some toy data, run your class through there, and then make sure that the functionality performs as desired.
AB: So unit testing each component of the pipeline and then putting it together, and then having more confidence in that one.
JG: Exactly. So showing the exact functionality and how it works.
AB: Makes sense. Andreas asked, “Are there any other Scitkit-Learn transformations or capabilities that you find useful?”
JG: Oh, that’s a good question. One that I’m thinking about—and I mentioned a little bit in the presentation—is extending the pipeline to do unstructured text and creating attributes out of that. Either try to identify words based off of counts, and then you can see which ones have the most counts, but then you can actually TF-IDF, extend that even further based off of certain types of identifications of terms that are frequent, but based off a low target rate, which ones are the most important. I would love to actually extend my current work that way, and I’m pitching it right now, so I’ll let you guys know later on if that works or not.
AB: amazing. Scikit-Learn has so much cool functionality. I feel like you keep discovering new ones as it shows up in your work.
JG: Oh my god, it’s huge. And there’s so much to do. So much to do, so yeah, just scratching the surface.
AB: And in terms of your work, are you mostly using tabular data, and therefore you’re mostly building Scikit-Learn pipelines? Or do you end up using a lot of like deep learning models and so you need to figure out how to build a pipeline around that, maybe, or other frameworks there? How does that look for you?
JG: Yeah, I’m mostly doing tabular data, so mostly it’s a fixed dataset that we are using to build models on.
AB: Makes sense. So I guess you’re not really using pipeline modules in other libraries for deep learning.
JG: No, that would be really cool, but no, I haven’t done that yet.
AB: What are your thoughts on existing tools that sort of maybe use more GUI-based operations for creating machine learning pipelines? From a lot of speakers, we’ve heard, a lot of push has been towards making maybe tools geared towards subject matter experts. Do you see that happening with the tooling that you are using? Or do you still think it takes a lot of data science knowledge, so we’re a while away from having SMEs drive this process?
JG: No, I don’t know. It’s a great question. And we’ve been talking about citizen data scientists for the longest time. Like, who does the process? Can we put that more in the hands of the subject matter experts? And then, maybe as data scientists, we’re more helping coach people along. Honestly, I think it’s great when people can both do it and then also…I don’t know. I think it’s good. I think it’s great for everybody to have data science knowledge that way.
AB: Makes sense. At least what we’re seeing at Snorkel is that subject matter experts are critical to that process. You want to involve them because—as you were mentioning—they’re the ones that know what feature is important. They’re the ones who can label the data. But maybe you still need some data science background, at least now to figure out, once you do train a model, what are the error modes, how do you fix that and do that loop most efficiently. We have a question from Matthew. He asks, “When to use Scikit-Learn versus TensorFlow or PyTorch. I guess if you’re using deep learning—in your case, I guess it’s tabular data, so you don’t really need the large deep learning models.
JG: Exactly. That’s why I would say they would be completely different. That’d be interesting to think about how you would clean data for image classification in that way with the padding and all that jazz, but I just don’t know if that would be really useful with the pipeline.
AB: Makes sense. And for your use case, neural networks are great for unstructured text, images, etc, but have not shown to be very much more effective in terms of tabular data anyway. So it makes sense that Scikit-Learn has these pipelines that you’re using. Makes sense. Just one last question. You talked about this pipeline that starts from looking at NaNs in the data, cleaning the data, and then getting to the feature engineering and modeling. There could also be a lot of errors introduced in the data collection stage, which is like, what is even the data you work with? How do you split up the data? Things like that. So do you have thoughts around the best practices you can develop there, which is like data collection, and how to marry that with the pipelines that you’ve built further down?
JG: That’s a good question. And I think in some ways when collecting the data, it’s hard, right? Sometimes we’re working with these datasets that have hundreds or even thousands of columns. How do you actually spend the time that you really need to and do the due diligence of assessing the quality of the data? What I find useful about the pipeline is that you can actually create a subset of columns of importance as it relates to your target, and then spend the time that you need on those columns to make sure that they’re reasonable and they meet the needs of the business that way.
AB: Got it. So it’s focusing on a subset of the data and then discovering issues that way, even if, they may have been started at the data collection stage, but you’re discovering it at the pipeline stage.
JG: Exactly. But then you have the limitation of you might have thrown something out that if you spent a little bit more time and care, you should have kept that column. And so, it has benefits and limitations like everything.
AB: That makes sense. Thank you so much Jason for the wonderful talk and for answering all the questions.
Catch the sessions you missed!
The Future of Data-Centric AI 2023, our two-day free virtual conference, brought together thousands of data scientists, AI/ML practitioners, researchers, and the AI community at large to hear about and discuss the latest trends and research in data-centric AI. If you registered for the event but didn't see all the sessions you wanted, you can now catch up. The recorded sessions are available for registrants at the same Zoom portal as the live sessions.

Recommended articles
View all articles

Agentic AI evaluation: Closing the gap with better benchmarks and data
Alex Ratner, co-founder and CEO of Snorkel AI, spoke at @Scale: Systems & Reliability about one of the most underappreciated problems in AI deployment: our ability to measure agents has been outpaced — arguably for the first time in the history of the field — by our ability to build them. The talk digs into what it actually takes to close that
June 23, 2026
•
Snorkel Team

JudgmentBench: Comparing Rubric and Preference Evaluation for Quality Assessment
At our latest Snorkel AI Reading Group, Russell Yang (AI Engineering Fellow at Stanford Law) stopped by our San Francisco office to present JudgmentBench: Comparing Rubric and Preference Evaluation for Quality Assessment. As AI models improve at open-ended tasks, the field faces a harder problem: how to measure quality in domains where ground truth is contested. Two paradigms dominate: rubric-based
June 18, 2026
•
Snorkel Team

The Art and Science of Building AI Benchmarks That Shape the Field
Vincent Sunn Chen spoke at AI Engineer London about what it actually takes to build AI benchmarks that move the field forward, not just measure it. The throughline is an asymmetry that keeps showing up across deployments and the 150+ proposals reviewed for the Open Benchmarks Grants: agent capabilities are climbing fast, but the ability to measure those agents with
June 16, 2026
•
Snorkel Team

