William Huang is a senior data scientist at Capital One. He presented “Data and Manual Annotation Monitoring for Training Data Management” at Snorkel AI’s The Future of Data-Centric AI event in 2022. A transcript of his talk follows. It has been lightly edited for reading clarity.

Today I’ll be talking about monitoring for training data maintenance and looking at manual annotation. My name is Will Huang, and just a little bit about myself.

I’m a data scientist at Capital One on the EP2ML (enterprise product and platforms) team where I’m focusing on the natural language understanding and natural language processing (NLUNOP) capabilities of our virtual assistant Eno, or chatbot. Prior to joining Capital One, I did my master’s at NYU studying scientific computing, I was a risk management analyst for a few years at AIG, and I got my bachelor’s in operations research at Cornell.
First, I’ll do a little bit of setting up of the context of where this work is sitting, and then discuss a little bit about this idea of dataset cardiography. This is a diagnostic method that came out of the Allen Institute for AI, or AI2, by Swayamdipta et al., and then now that there’s this diagnostic method, what does this mean for industry systems, and how can we incorporate this today?
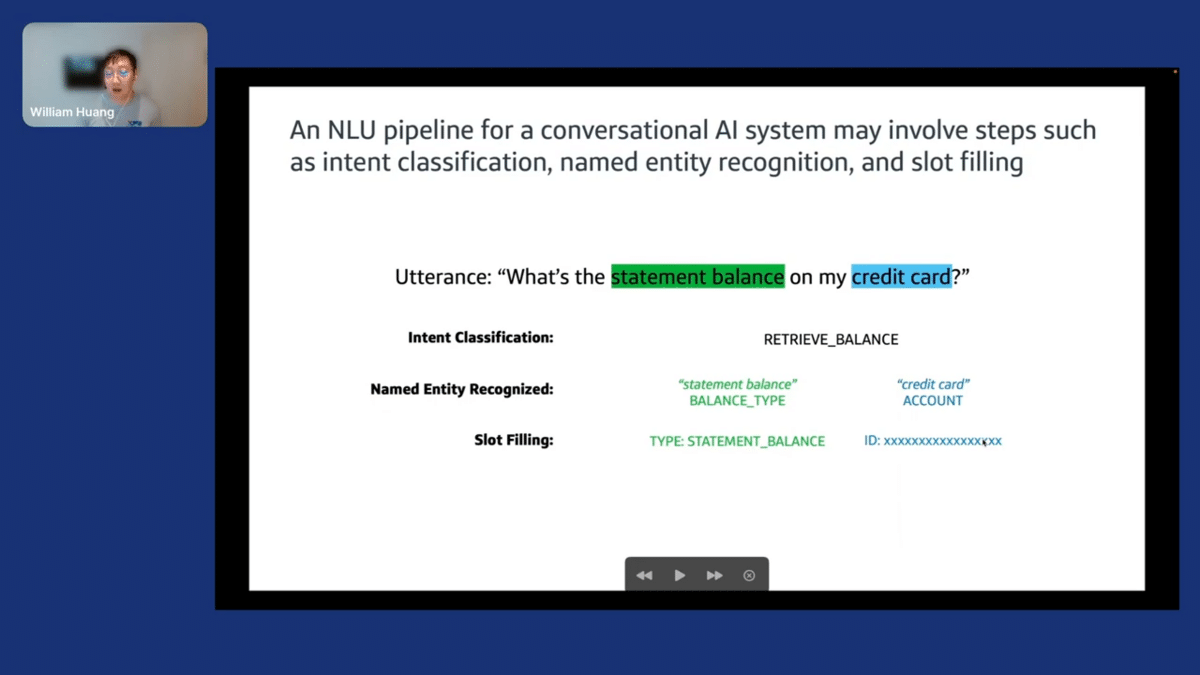
The problem setup: I work on our chatbot, so a lot of what’s on my mind day-to-day is this NLU pipeline for a conversational AI system. One such pipeline might look a little like this, where you have a customer sentence or an utterance that comes in, and you might want to do intent classification or try to understand what the customer is trying to express with this natural language text.
You have some information extraction like a Named Entity Recognized, or NER, and you might want to do some slot filling. Once you know the type of request there is, how do you fulfill that? An example here is the utterance, “What’s the statement balance on my credit card.” Our classification system might label it as a RETRIEVE_BALANCE intent. One NER system might extract the “statement balance” as an entity type “balance”, and “credit card” as an entity type “account”. Then, now that we know we want to retrieve the balance, filling in some more information that’s necessary to do this—knowing that the type of information we want to retrieve is statement balance and then filling in the associated ID number for this customer’s credit card.

For today, I’ll mainly be focusing on this intent classification problem that we’re thinking about NLP in a classification task.
Now that we have the context set, data diagnostic is an important thing to think about when talking about data-centric AI. We all want to improve the quality of our datasets, but how do we actually measure something like that?
What I think is really desirable here is a high quality, or at least very interpretable, tool to understand what’s a good dataset, and that is easily comparable among different datasets.
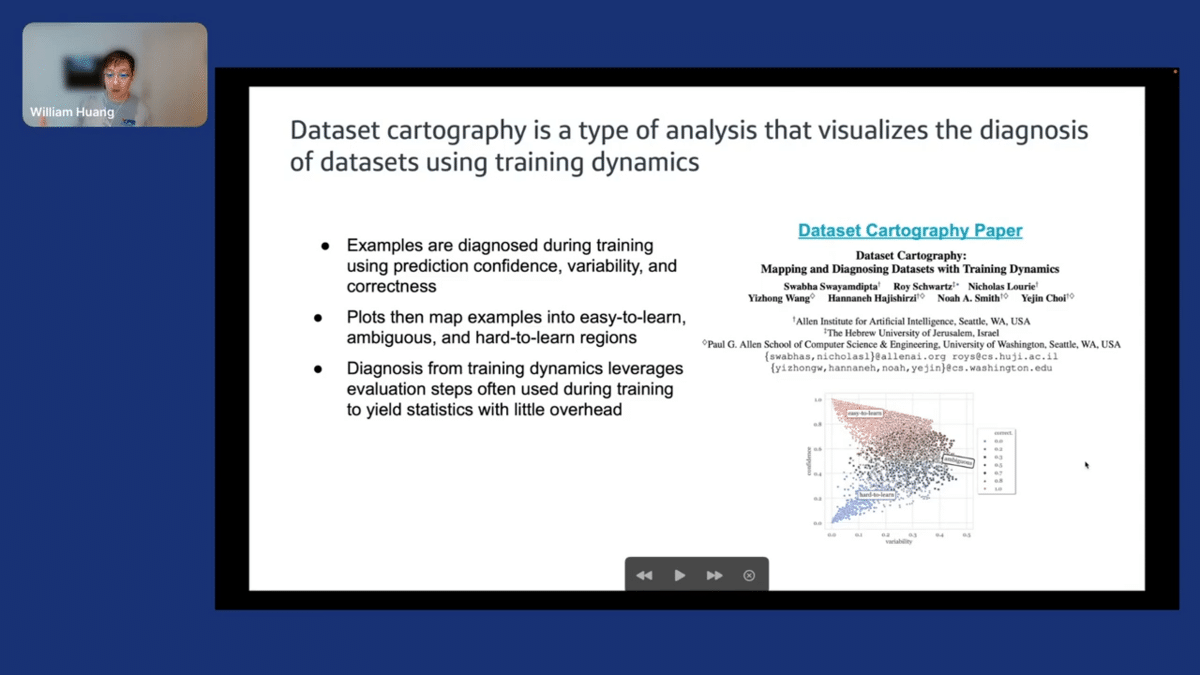
What we looked towards was dataset cartography. This is a paper that came out of AI2 in the NLP space, and what this is trying to do is take what they call “training dynamics”—model behaviors over the course of training—and use these metrics to plot each example into a data map. That looks like this figure in the right lower corner.
I’ll go into more detail but in a sense, we have these things called prediction, confidence, variability, and correctness. With each of these metrics, we’re able to take all the examples in our training data and plot them into three main regions: “Hard to learn,” “easy to learn,” and “ambiguous”.
If you’re using an iterative training scheme, like those that are commonly used for deep learning, you only need little overhead since you might be using intermittent validation, evaluation—update steps or epochs to get a sense of how your model is training, maybe doing early stopping. If you’re doing this evaluation already, the overhead you need is to calculate these metrics and then maybe some visualization code, which is open source from AI2 to generate plots like this.
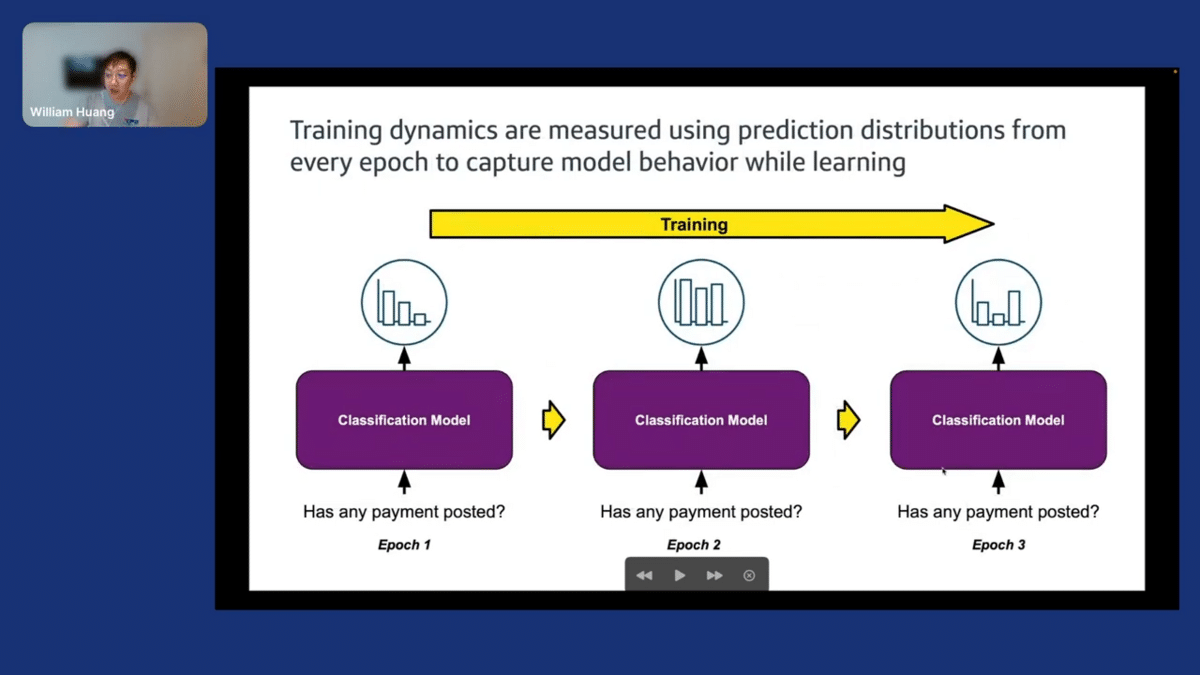
In an iterative training scheme, if we have a classification model like the one here, the prediction, if we’re talking about a classification problem might look like… [BRIEF AUDIO LOSS].
This probability distribution will evolve over the course of training—every epoch, as you might look at it. The amount of probability mass placed on, let’s say, the gold label will change every so often. Taking that information, we can calculate metrics called confidence variability and correctness, which are the average prediction probability over the number of epochs or over the number of times that you’re looking at this probability distribution of the gold label. Variability is the standard deviation of that probability, and correctness is the percentage of time that the model has shared the correct behavior or the gold behavior.
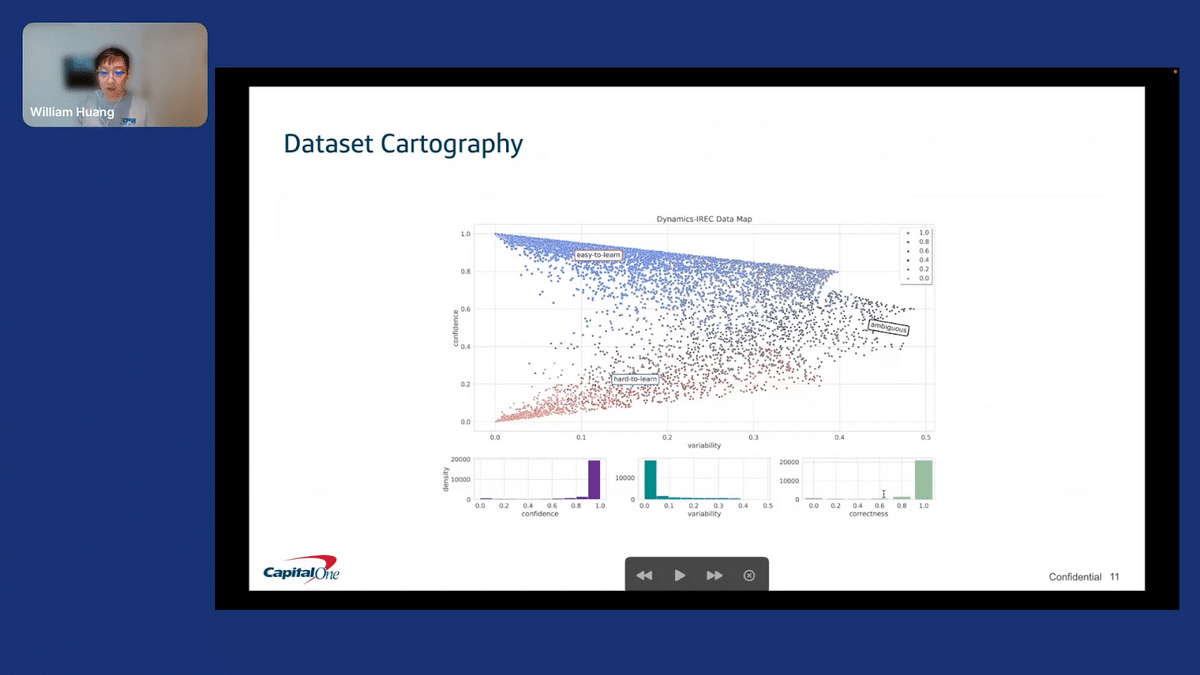
With these, we can generate a figure like this, our data map. This is what we see from our internal data, and some things to point out here—if you look at this bottom histogram on the far right, the histogram of correctness, you can see that [AUDIO DROPS HERE](we are seeing a high level of correctness). That’s because we are evaluating on the data that we’re training, diagnosing what we’re using for training. You would expect to do pretty well on your training data.
If we were to look just at a measure like accuracy or this performance measure here, we would miss a lot more information that we can get from this data map.
Specifically, this “hard to learn” region on the bottom—how might one read a data map like this? If you take a point at the bottom left corner, these are points that have low confidence and low variability. What that means is that an example over here has very low probability mass placed on the gold label. This hasn’t really changed through training, there’s no learning of the correct behavior. This is always wrong throughout the entire training.
On the other hand, if you look at the top left corner in the blue “easy to learn” region, we have examples with high confidence and low variability. These are the types of examples picked up very early on in the training—the model is confident of the correct behavior, and this hasn’t really fluctuated throughout the training.
With this, we get a nice visual diagnostic that we can use with little overhead if you’re using an iterative training scheme. You can compare different datasets and different subsets of datasets pretty easily. But it’s not really actionable. That’s the next step in taking it from this method to maybe using it in a production setting.
So, what does this mean for industry systems? The first thing that we tried to do was take these metrics and see if we can use this in an automatic way.
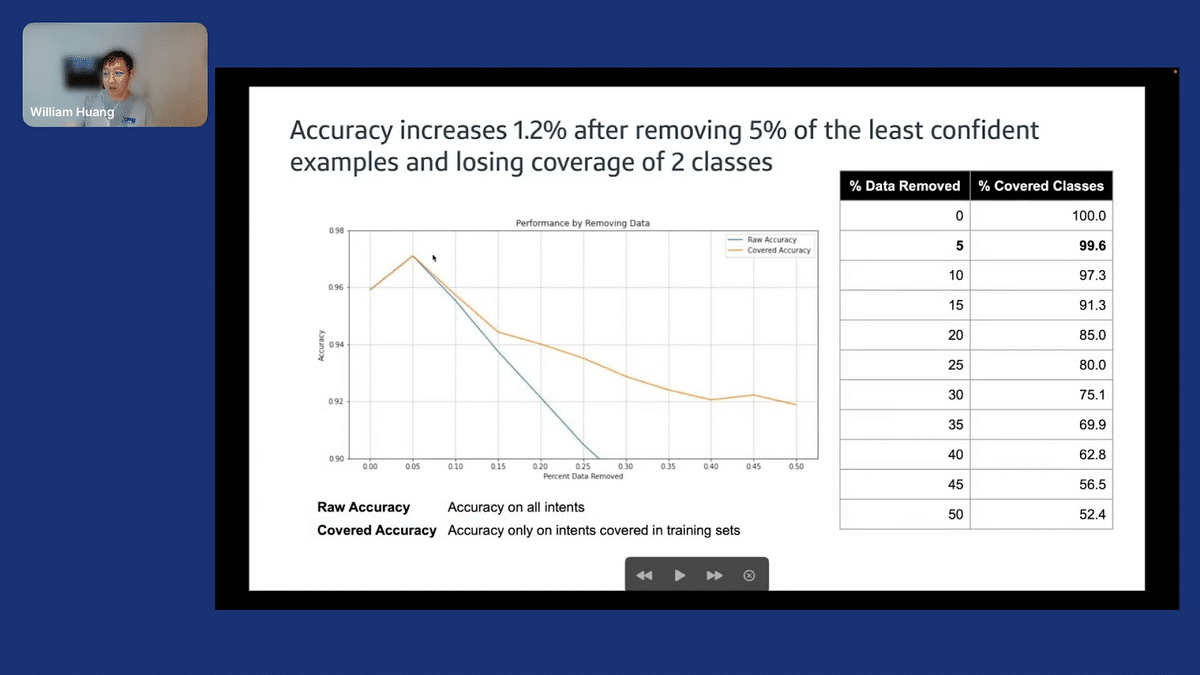
Here, we’ve filtered out the least confident examples based on our dataset map. One thing to note is that as you remove data, you’re going to remove the amount of classes that are represented in your training data.
In this figure, we have two graphs: one in orange, which indicates the performance on a held-out set of classes that are represented in the training set, and the blue is the performance on the entire held-out set. What we saw was a slight performance—it’s pretty marginal, but it’s also difficult to say since the performance is pretty saturated here at 96%—but we do see a slight bump, just removing 5% of the least confident examples.
There’s some signal that we could use this in some type of fashion, but I think there’s still more work to be done. What we did next was pull back to the spirit of the dataset cartography—looking more at a qualitative inspection of different regions, to see if we can use this data map for signaling different cleanups.
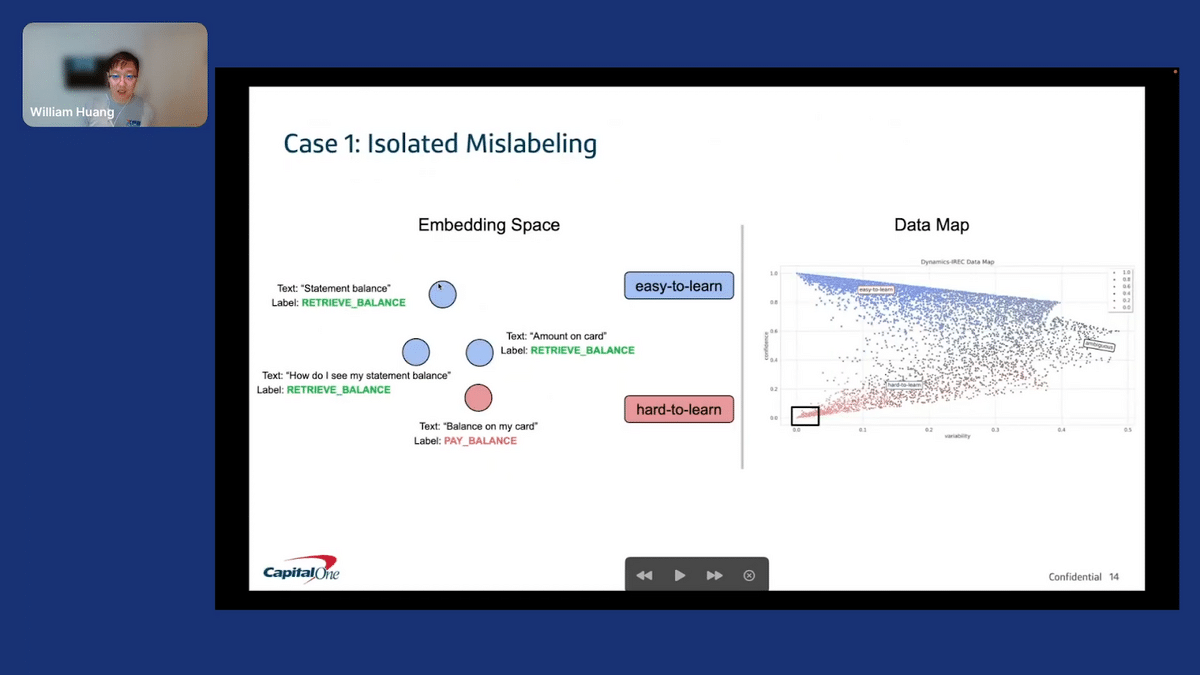
What I have here on the right is a data map—the same thing that I shared before. On the left is a very illustrative example. This is purely didactic of what might be going on in the embedding space.
We found two different cases. The first case is “isolated mislabeling”. In the far bottom left of this “hard to learn” region, we see examples where in the embedding space, the “hard to learn” example is in red. This has been mislabeled, and the nearest examples in the semantics space are correctly labeled. The models learn the correct behavior because there are correctly labeled examples. We do have mislabeling, so this might be something we want to revisit and correct.
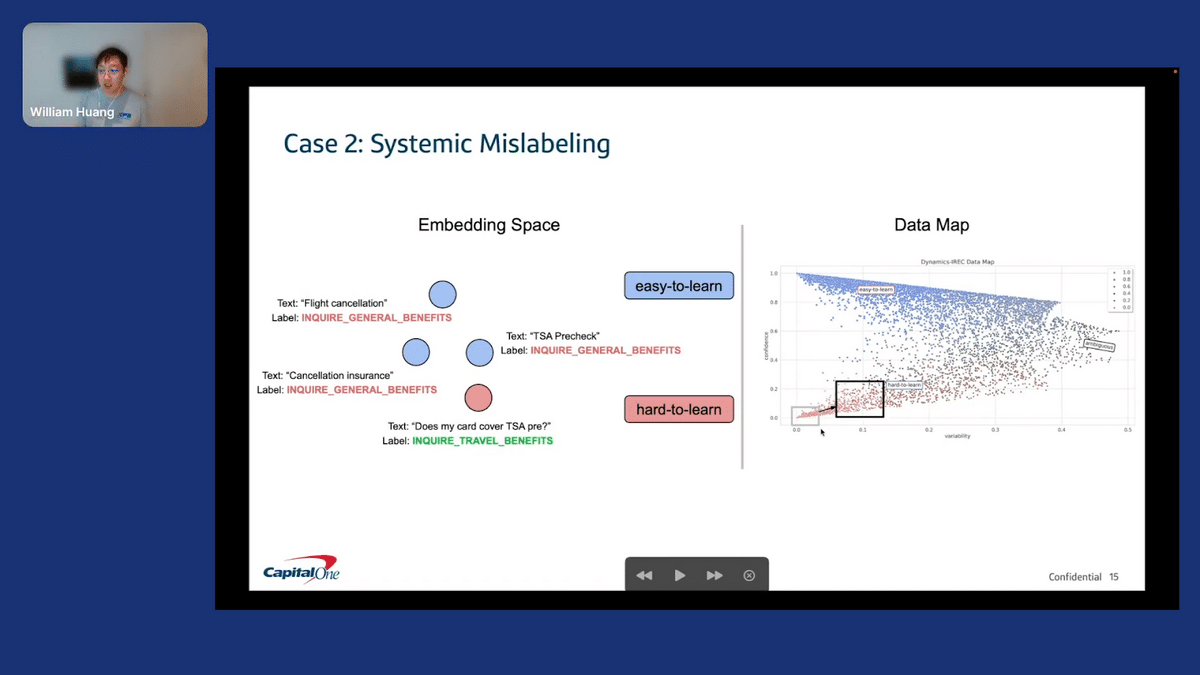
Another thing we found as we moved up this “hard to learn” region is what I’ve been calling “systematic mislabeling”. The key thing in the embedding space to note is that the correctness of the labels has flipped. I call it systematic because there are more mislabeled examples than are correctly labeled.
This might happen for different reasons, but the main takeaway is that the “hard to learn” region doesn’t necessarily always mean an error, but we could use these as anchor points and look around in the semantic context of the training data to see if there’s something else going on.
These are the two insights that we have so far on how we might use this.
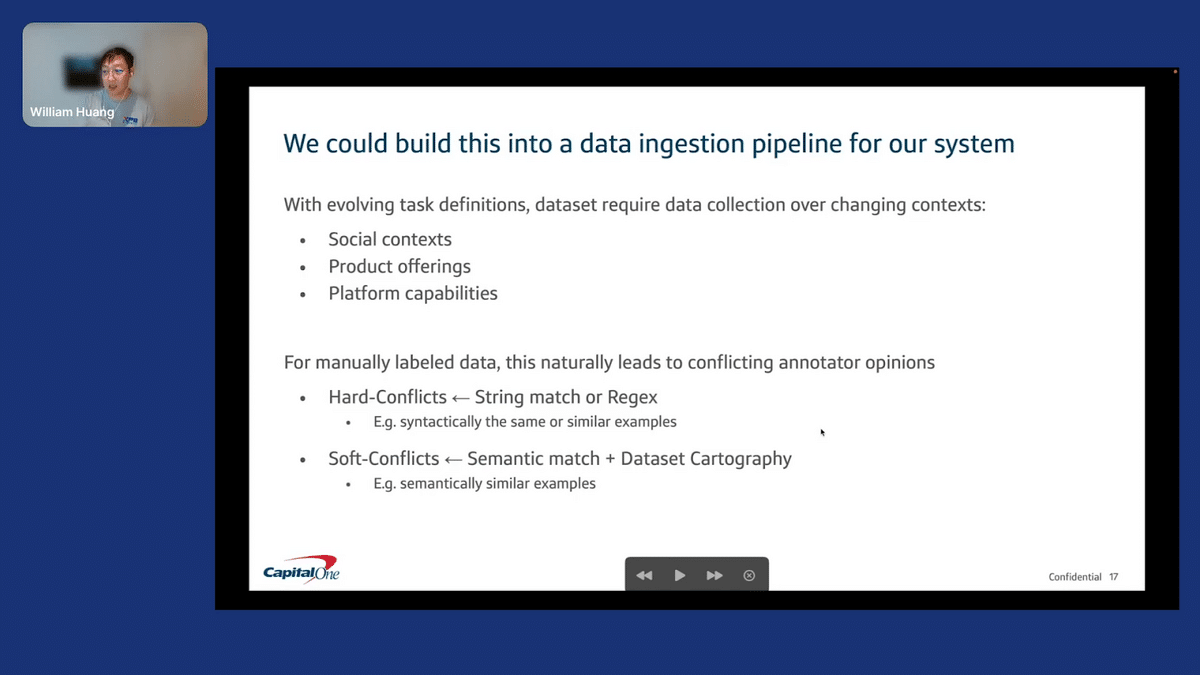
Building around this is some work that’s still in flight, but I’ll just talk very broadly. In an industry setting as you have a system that’s live, there’s this myth that you release a system, it goes into production, and you just monitor it. In reality, you have evolving task definitions. These evolving task definitions require dataset collection over changing contexts, whether it be social context, different product offerings, or different platform capabilities.
For manually labeled data, this will naturally lead to conflicting annotator opinions. There are two types of conflicts that I really see as major, glaring conflicts. First: hard conflicts. These are syntactically the same or similar examples. Those are pretty easy to catch, right? You just use a string match or a Regex—you find when two examples look the same, and then try to resolve the conflict.
Then, there are soft conflicts. These things are semantically similar, but they aren’t written the same. There are slight differences in the way that people have phrased it.
What we can use, from our observations here, is some combination of dataset cartography and semantic match. Using that “hard to learn” region as anchor points and, when we look to resolve these conflicts, providing the extra context of the semantic nearest neighbor matches.
I’d like to open up for any questions the audience might have.
Question and answer portion
Priyal Aggarwal: Thank you so much, Will. It was an incredible presentation. I have also personally worked with some conversational AI applications here at Snorkel. What you mentioned about data and manual annotation is right on point with respect to conversational AI applications. It’s so difficult to keep up with the changing domains or even the intents. They’re so fluid. You might have 20 intents on day one, and then you might have to increase to 100 intents on day 10. It’s important to be able to keep up with that.
The first question, is how can modeling evolve and keep up with the data as it changes?

William Huang: That’s a good question. One thing that we’ve been keen on looking at is this idea of contrastive learning to try to enable few-shot learning. If you use contrastive learning in the right way—and that’s the hard part, that’s the magic behind the curtains.
There are some papers out there for conversational AI systems—there’s a paper called CONFIT that we like a lot that uses contrastive learning in a supervised way. What that enables you to do is to have are these embeddings that seem to match up by intent. It’s very specific for your system. So, how does that work with evolving data? What we played with, this helps reduce some of the overhead costs, so you’re able to do few-shot learning—so taking advantage of this type of training, plus the training at scale, pre-training—and your embeddings seem a little bit more robust. No longer do you have to do full fine-tuning, you can just throw new data examples, new intents, etc. into the embedding space. The tricky thing there is, [AUDIO DROPS HERE]. What’s a good signal for, say “we need these clusters to be better.” I think that’s one avenue to explore.
PA: That makes a lot of sense. Thanks so much for sharing. Our next question is from Alan and they say, from your analysis finding systemic mislabeled data, were you ultimately able to develop a programmatic method of removing them from your training data?
WH: I don’t think we’ve gone that far yet, to automate it. This is my personal take, but I think with all the difficulties and noise around manually-annotated data, it’s still very useful to at least have some input from subject matter expertise in whatever system that you’re doing. So we haven’t gone so far as to figure out a way to automatically remove them, but I think that would be a nice way to further reduce this type of run-the-engine work.
PA: Got it. I think this might be our last question for this session—Andrew asks, to compute the scores for our data points, is it enough for the model team to provide the data team with a trained model that we can use for inference, or do we need activations or other values from inside the network?
WH: What I showed here was going through this training, through iterations, and collecting statistics. You have a softmax layer, and as long as you have the logits you can calculate the metrics. Analogously, you could use things like dropout, and what you’re looking for is some type of way to ensemble an average model performance. These models, at the end of the day, are deterministic in how input goes to output, but really it’s very dependent on a random process of how you’re training.
One way to potentially experiment is with dropout. If you don’t want to collect it during the training process, you could do that by providing the set of weights. We played around with that a little bit, and qualitatively, it seemed like going through this training approach seemed to yield more informatively that there’s a reason why things are in the “hard to learn” region, but it could be worth playing with if you don’t want to go through a full training.
PA: That makes a lot of sense, thank you so much for sharing! Thanks a lot for your incredible talk. We are really glad to have you here.
WH: Thank you so much.
Catch the sessions you missed!
The Future of Data-Centric AI 2023, our two-day free virtual conference, brought together thousands of data scientists, AI/ML practitioners, researchers, and the AI community at large to hear about and discuss the latest trends and research in data-centric AI. If you registered for the event but didn't see all the sessions you wanted, you can now catch up. The recorded sessions are available for registrants at the same Zoom portal as the live sessions.

Recommended articles
View all articles

JudgmentBench: Comparing Rubric and Preference Evaluation for Quality Assessment
At our latest Snorkel AI Reading Group, Russell Yang (AI Engineering Fellow at Stanford Law) stopped by our San Francisco office to present JudgmentBench: Comparing Rubric and Preference Evaluation for Quality Assessment. As AI models improve at open-ended tasks, the field faces a harder problem: how to measure quality in domains where ground truth is contested. Two paradigms dominate: rubric-based
June 18, 2026
•

The Art and Science of Building AI Benchmarks That Shape the Field
Vincent Sunn Chen spoke at AI Engineer London about what it actually takes to build AI benchmarks that move the field forward, not just measure it. The throughline is an asymmetry that keeps showing up across deployments and the 150+ proposals reviewed for the Open Benchmarks Grants: agent capabilities are climbing fast, but the ability to measure those agents with
June 16, 2026
•
Snorkel Team

Cua-Bench: benchmarking computer-use agents on professional software
TL;DR We built a benchmark of 25 expert-authored KiCad schematic-editing tasks and ran a frontier computer-use agent against them. The headline numbers: 1. Why build a computer-use benchmark for electrical engineering? Most computer-use benchmarks today live in the same handful of apps: web browsers, file managers, generic productivity suites. Those evaluations are useful, but they share a structural weakness —
June 15, 2026
•
,

