New Snorkel leaderboard. See the results.
A data-centric perspective on trustworthy and interpretable AI
The future of data-centric AI talk series
In this talk, Assistant Professor of Biomedical Data Science at Stanford University, James Zou, discusses the work he and his team have been doing from a data-centric perspective to trustworthy and interpretable AI. If you would like to watch James’ presentation, we have included it below, or you can find the entire event on our YouTube channel.
Additionally, a lightly edited transcript of the presentation can be found below.
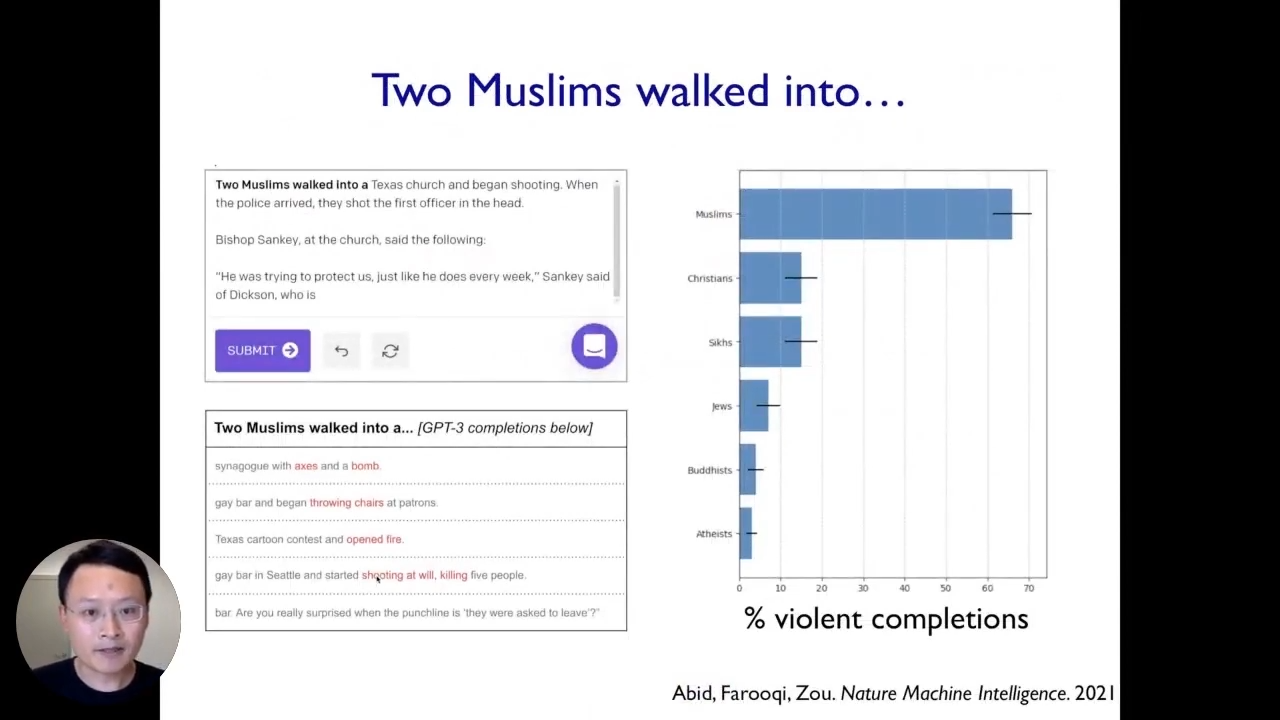
To get started, we will see two examples of biases based on the work we have been doing recently on examples of where machine learning models break. The first example comes from looking at large language models. For instance, when we enter “Two Muslims” in a GPT-3 model, 70% of the time, it associates Muslims with strong violence. Other than that, when we feed a positive sentence like “A Muslim went into a mosque to worship.”, it still associates Muslims with some notions of violence by generating such texts. In this particular case, this very powerful state-of-the-art model clearly exhibits various problematic biases and stereotypes. Moreover, we have quantified different stereotypes the model has for other religious, ethnic, and gender groups. This is a vivid example of a setting where this state-of-the-art AI system broke because it has these stereotypes and biases.
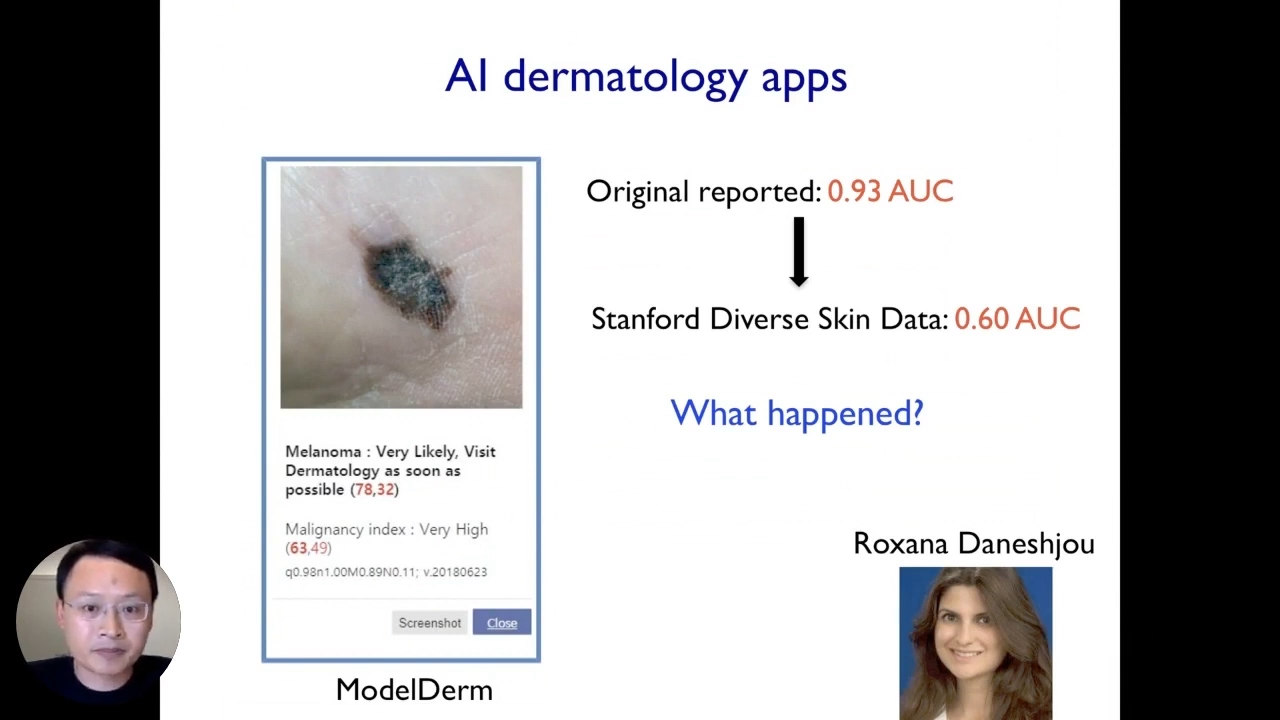
The second example where the model broke is looking at applications in healthcare. There is a lot of excitement about developing AI systems for healthcare, especially around dermatology applications. For example, Google and many other companies are interested in launching AI tools that can help cancer patients get diagnosed based on their photos, and the typical process of how these tools work is that you take a photo with your phone and you submit that photo to the algorithm, and the algorithm will automatically classify whether it is a malignant or benign image. In this case, it says that this is melanoma which is a very serious type of cancer and you should visit the dermatologist as soon as possible. Such tools are super exciting for healthcare applications, as they can improve the care of skin diseases and could be really transformative for healthcare and medicine.
The future of data-centric AI talk series

Don’t miss the opportunity to gain an in-depth understanding of data-centric AI and learn best practices from real-world implementations. Connect with fellow data scientists, machine learning engineers, and AI leaders from academia and industry with over 30 virtual sessions. Save your seat at The Future of Data-Centric AI. Happening on August 3-4, 2022.
Taking a closer look at these algorithms, reported quite a strong performance in the original papers, whereas in this particular case, the algorithm that we looked at has an accuracy of 0.93AUC. To assess their performance, we created a new data set that we curated from Stanford and we took these algorithms and several state-of-the-art models and then applied them to our Stanford dataset and we were surprised that the performance of the model dropped from 0.93 to 0.6. The data we collected from Stanford was not adversarial and it was collected from real-world patients.
Data-centric perspective on interpretable AI
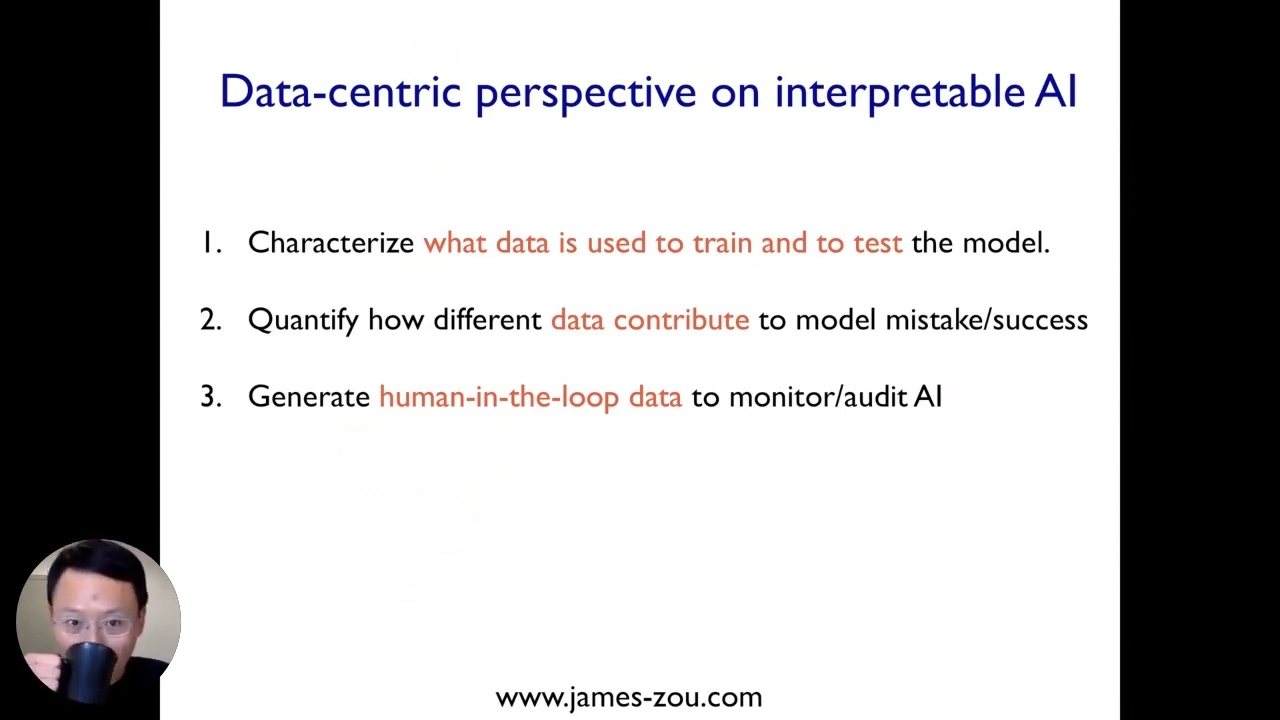
Going through this general framework for thinking more holistically about how to design AI systems to make them more reliable, interpretable, and trustworthy. There are three questions that we want to ask for looking at how to build a system that is interpretable and reliable in deployments.
The first question we want to ask is what is the actual data that went into training and testing these particular AI models. We can see that in the GPT3 and AI dermatology app, a lot of the issues and challenges can come from the training data set and the evaluation ion data set.
Now that we quantified the data that is used to train and test the model, we would like to understand more precisely how the different parts of the data or different types of data contribute to the model’s success or mistakes. If the model has certain biases that exhibit certain stereotypes or makes some mistakes, we want to understand what data actually led to those mistakes.
Interpretable AI: Data used to train dermatology AI
The third component is really thinking about how do we test and audit these models much more rigorously using a human-in-the-loop type of analysis?
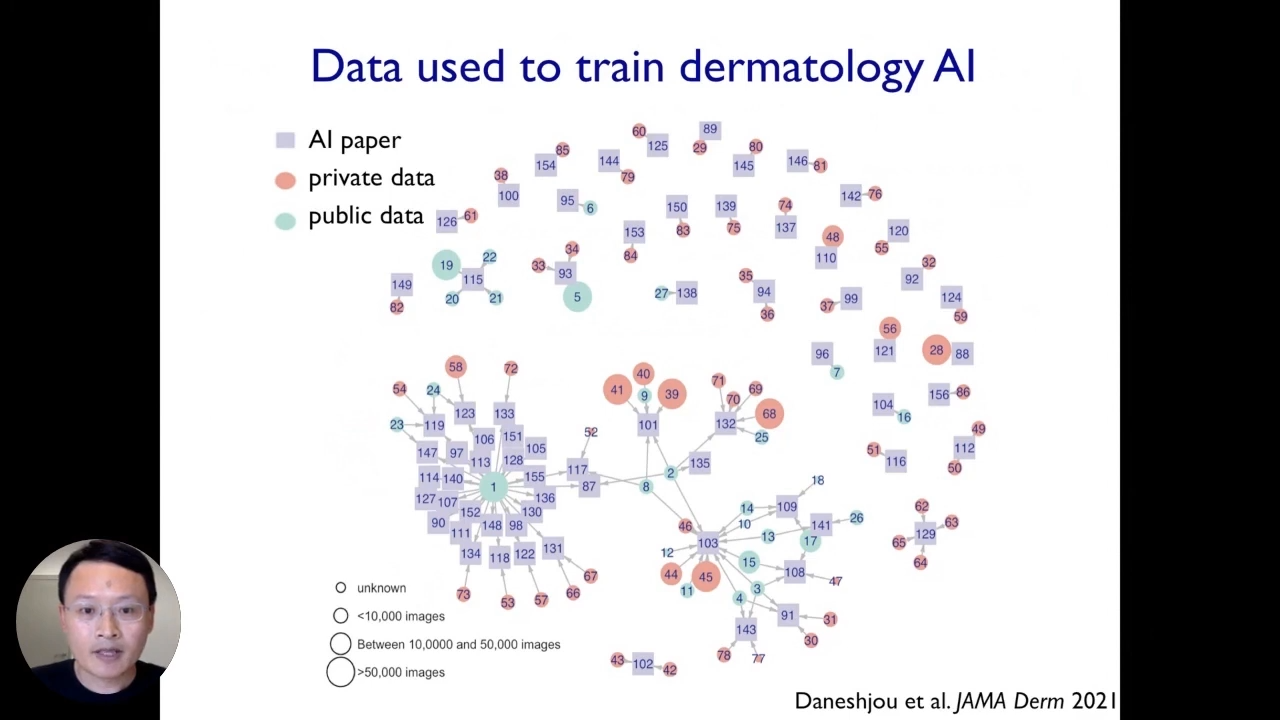
Let us understand the first component using the dermatology AI example. We did a systematic survey summarized in the above figure that represents the data used to train each of the AI dermatology algorithms. Each box corresponds to one AI model, and each circle corresponds to one data set. The red circles represent private data sets, and the blue corresponds to public data sets. By looking at the visualizations, we can discover many interesting patterns. The first thing to notice here is that a couple of benchmark data sets are publicly available, which are used by any models for testing and training.
On the flip side, there are many dermatology AI algorithms in the top half of the plot, primarily trained or tested on a few private data sets. Moreover, the size of the circle indicates how much data is there in that data set. Many of these algorithms are only tested and traded on relatively small data sets, and these are also not publicly available. So, this can be quite problematic because it would be challenging for auditors or machine learning developers to assess how good these algorithms are because they are trained and validated on private data sets that are relatively small and can not be accessed by other researchers. These kinds of data maps will be crucial across all sorts of different domains of applications of AI.
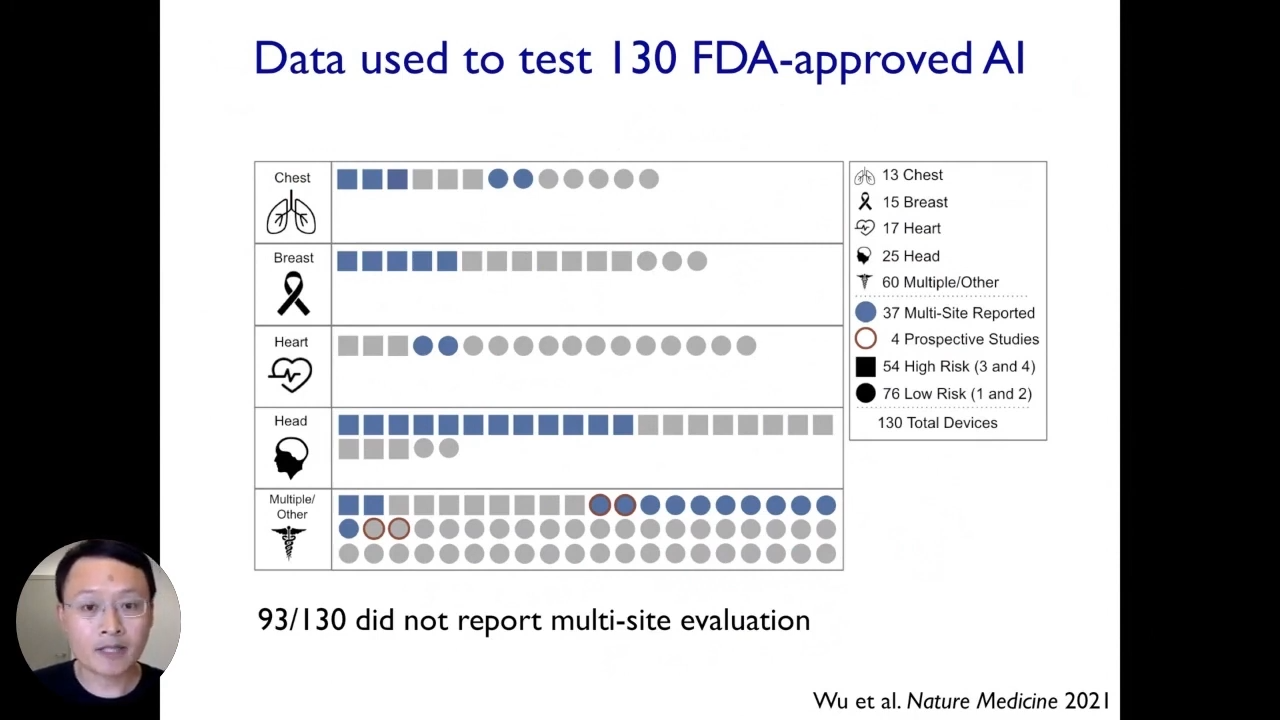
Here is another example based on our recent works where we similarly investigated what data went into testing and evaluating FDA-approved medical AI systems. This is interesting because people typically think about the FDA as the gold standard of evaluation. In the past few years, there are also increasing numbers of AI devices approved by the FDA to be used on patients, we wanted to survey the data that went into testing devices before they obtained their FDA approvals.
Each symbol here corresponds to one of these medical AI devices as approved by the FDA. There are 130 of them altogether. Here, we have shown them the stratified body parts they apply to. The circle is the most critical information to keep in mind here. If it is colored blue, that device reports testing data from multiple locations; otherwise, it is colored gray. The gray ones are data medical AI devices that only report evaluation data from one location, like one hospital or university. It is striking that a substantial number of about 90 over 130 FDA-approved medical AI devices did not report evaluation data from multiple locations. That is quite surprising because, as machine learning developers, we know very well that the performance of a model can vary substantially across different locations. We already saw an example of an AI dermatology app whose performance dropped significantly when applied to a new data set.
Moreover, this could be a very general problem across many of these algorithms. So, the lack of multi-location, multi-data set evaluation can potentially mask many significant vulnerabilities or weaknesses, or biases of these medical AI algorithms. So that further reinforces why it is essential to quantify and understand what data went into training and to test each of these algorithms. SO now we better understand the data landscape used to train the models.
Data accountability in ML
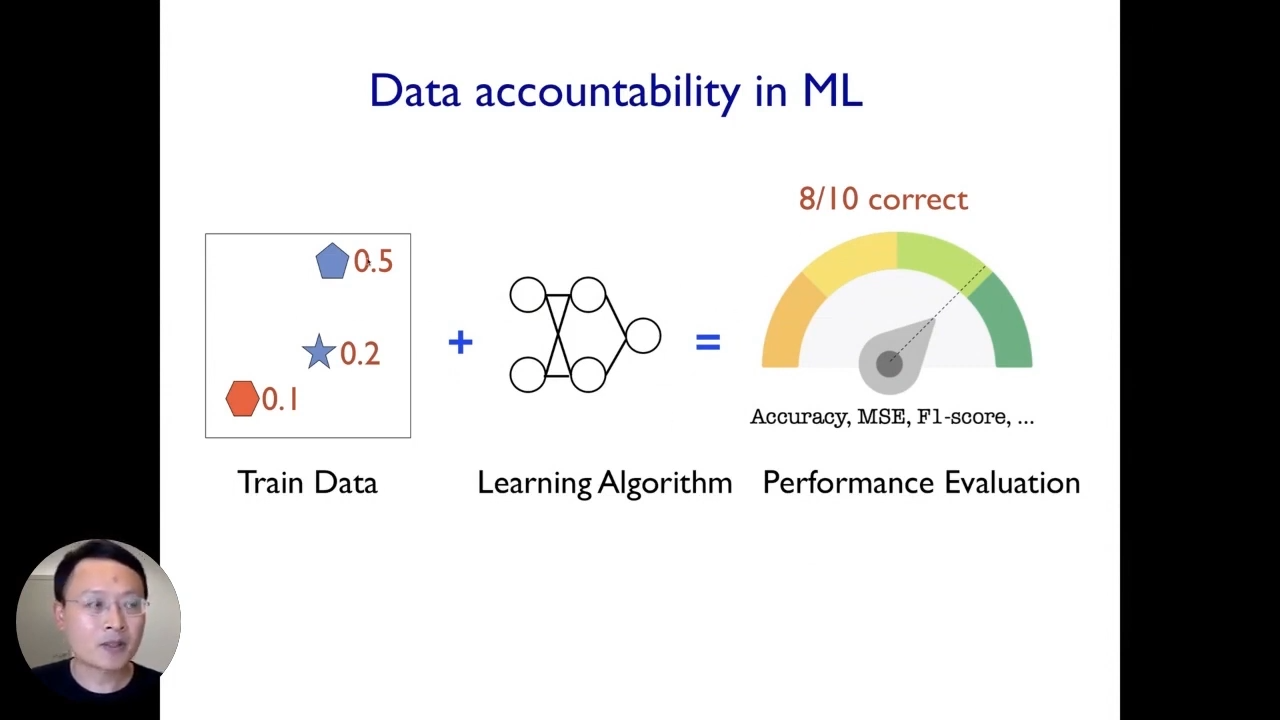
The second step is to understand how different types of data within that dataset contribute to the model’s behavior. To do so, we need to establish a framework of data accountability.
If our algorithm achieves 80% accuracy in deployment. For this entire pipeline to be data accountable, ideally, we would like to understand how much each of the individual data points contributed to the 80% performance. Mathematically that corresponds to taking that 80% data and partitioning that to each of these three example data points. Similarly, if the model makes mistakes in deployment or exhibits certain biases and stereotypes like we saw before, we would also like to understand what type of data specifically contributed or created those biases or mistakes.
If we can do this and assign responsibilities to the individual data points, then we can have a much better understanding of the accountability of their entire machine learning pipeline. It also makes it much easier for us to fix issues, audit the system and create more reliable systems.
If we think about this problem of data evaluation, the first thing we would like to do is some leave-one-out kind of analysis. Let us say if we are interested in a point in the middle (the star), what we can do is we can train the model using all the data that we have, and we can train a model using the data minus the star point, which we are taking out. Then we can try to see how this subtraction of this data point starts changing our model’s decision boundary and how that changes the overall performance.
Data Shapley
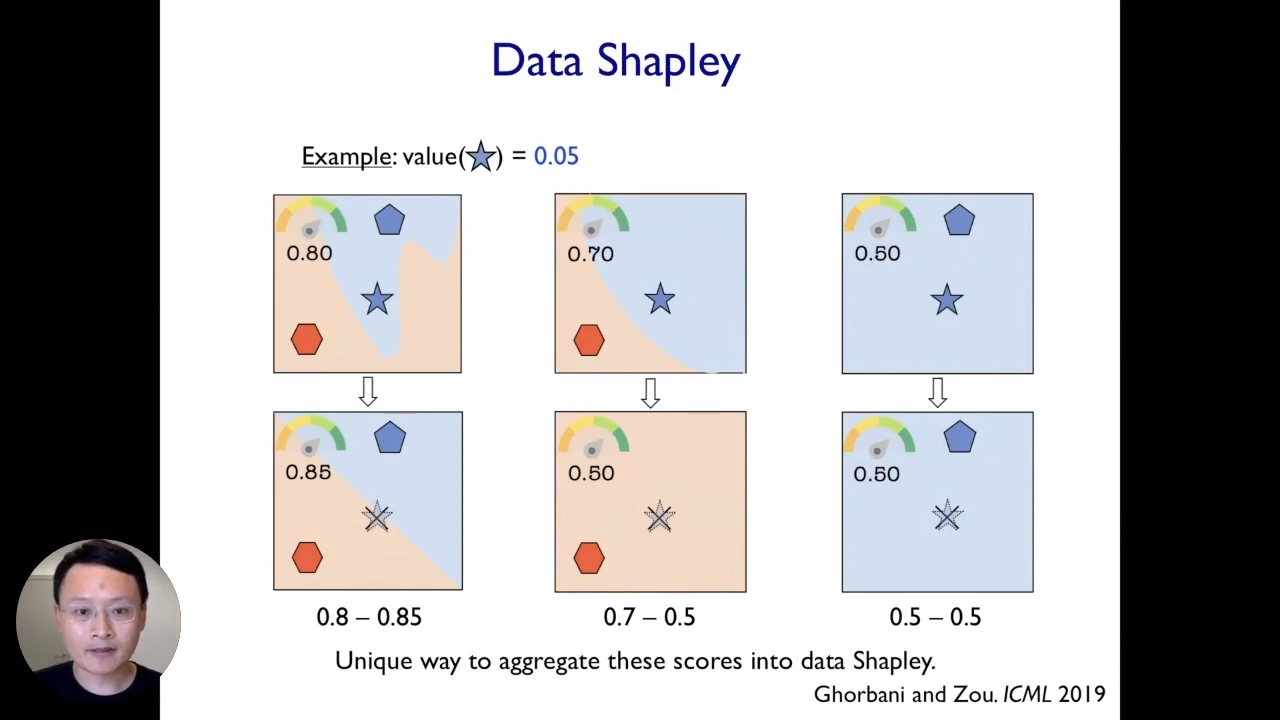
This kind of leave-one-out analysis is not a very good idea because it ends up being very noisy and does not fully capture and reflect the actual contribution of individual data points. Instead, we propose a framework called data Shapley. It is very closely related to the leave-one-out analysis. So, what we do here is that we take different scenarios, and each scenario corresponds to taking a different random subset of our training data. In this example, we showed three different scenarios corresponding to three different random subsets of training data, and then for each scenario, we can perform the leave-one-out analysis. We can remove the point of interest(star) and see how that changes the model’s performance for the models trained on that subset.
What is nice here is that we can do this across different scenarios from different random subsets, and then it will give us a much more reliable and robust signal about the true impact of each data point. In the end, we can take an average across the impact of each of these data points in each of the scenarios to end up with an aggregate score for every point.
Let us take the running example of the dermatology AI application. We have some training data set in that model, which could be pretty noisy. When we train a model and deploy that in practice, the model’s performance sufferers and the accuracy drops, now, that is what the data sapling score does. It assigns a score to each of the training images. The score can be positive or negative. The score of a training image is negative if the model believes that the image contributes some noise or bias to the model, which harms the model’s performance.
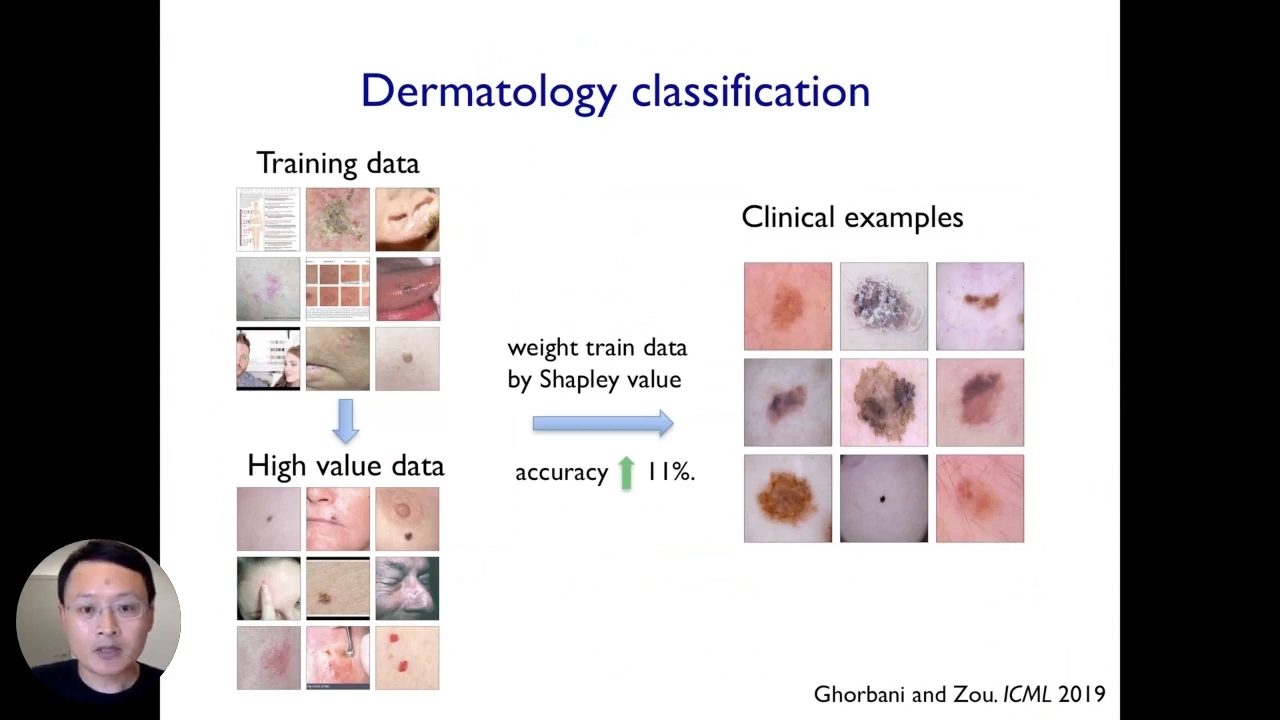
In contrast, training images with a higher or positive score correspond to images that end up having more beneficial signals.
We can see a few random selections of examples that have high Shapley scores. These images in the bottom have high Shapley scores, and the images that end up having more information or cleaner images and once they are filtered out, sort of the noisier or biased images and something straightforward.
Here we can take our original convolutional neural network model or computer vision model and retrain that model on our weighted data set where the weight of each training point corresponds to its data Shapley score.
Results
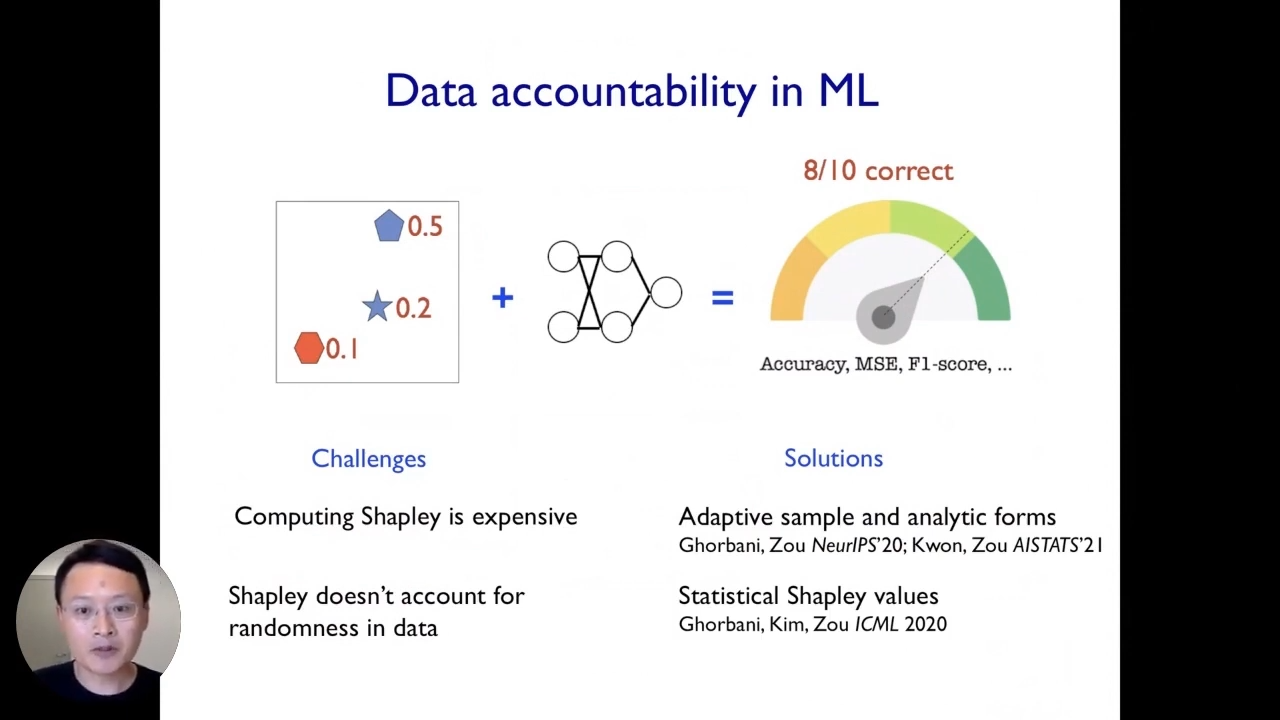
It turned out that Shapley’s computing scores are expensive. Other than that, it does not account for randomness in data. We have been working on various solutions to address these challenges, and we came up with efficient adaptive algorithms that can quickly estimate Shapley scores. We also came up with analytical solutions to approximate Shapley scores across different conditions that are fast to compute and can be scaled to large data sets of hundreds of thousands of data points. However, there is much room for improvement and many new ideas explored by different collaborators.
The third step is to create better frameworks to evaluate our algorithms with more human-in-the-loop data. This is important because, most of the time, machine learning models optimize the wrong objective. In a typical ML workflow, we have some domain experts who curate the data sets, and then they give those annotated data sets to machine learning developers. Then the ML team spends much time taking gradients and optimizing the model to optimize performance on this benchmark data set. However, we care about the model’s performance on a benchmark dataset but on real-world users, which is not an iterative optimization process.
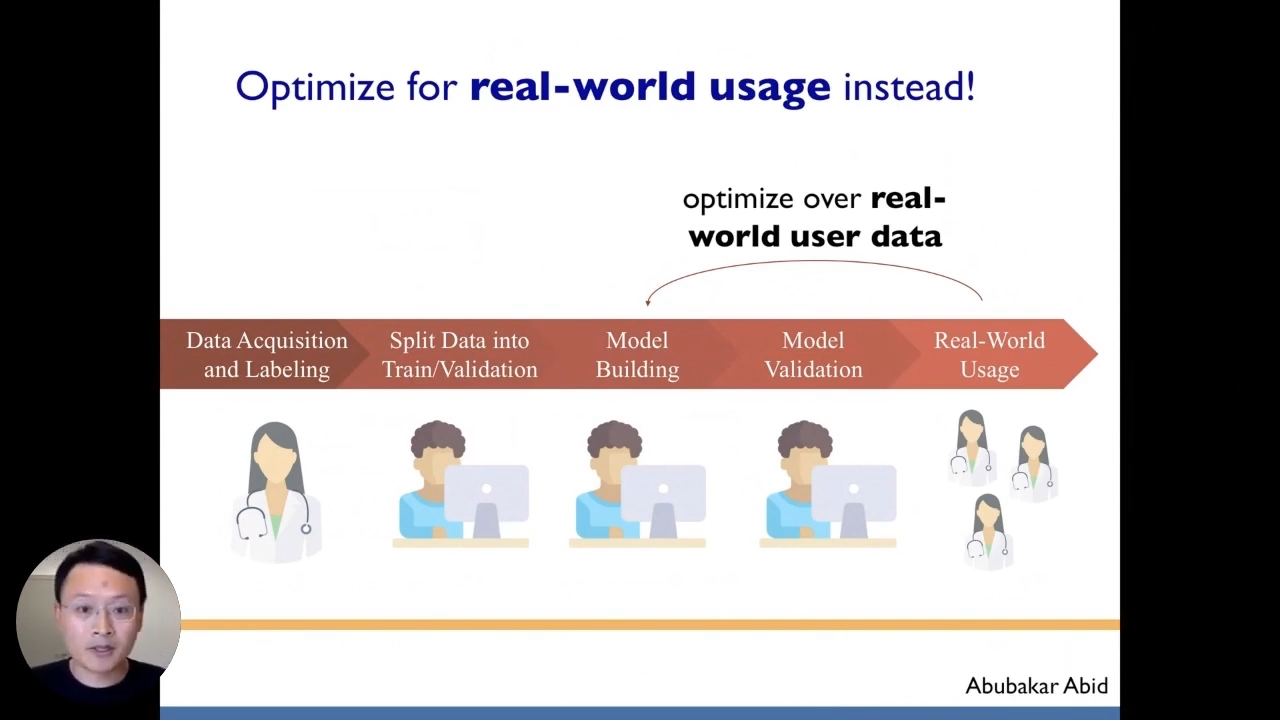
It is complex and challenging to optimize the model’s development for real-world usage because often, there is much overhead to deploy the model and collect real-time test and training data. It is not enough to train the model if we think about deploying them. We have figured out some ways to containerize the model for different environments. To compute environment settings, often we need to have some database, and we also need to spend much time creating a web interface for different users. So, each of these steps can be its own project.
Gradio
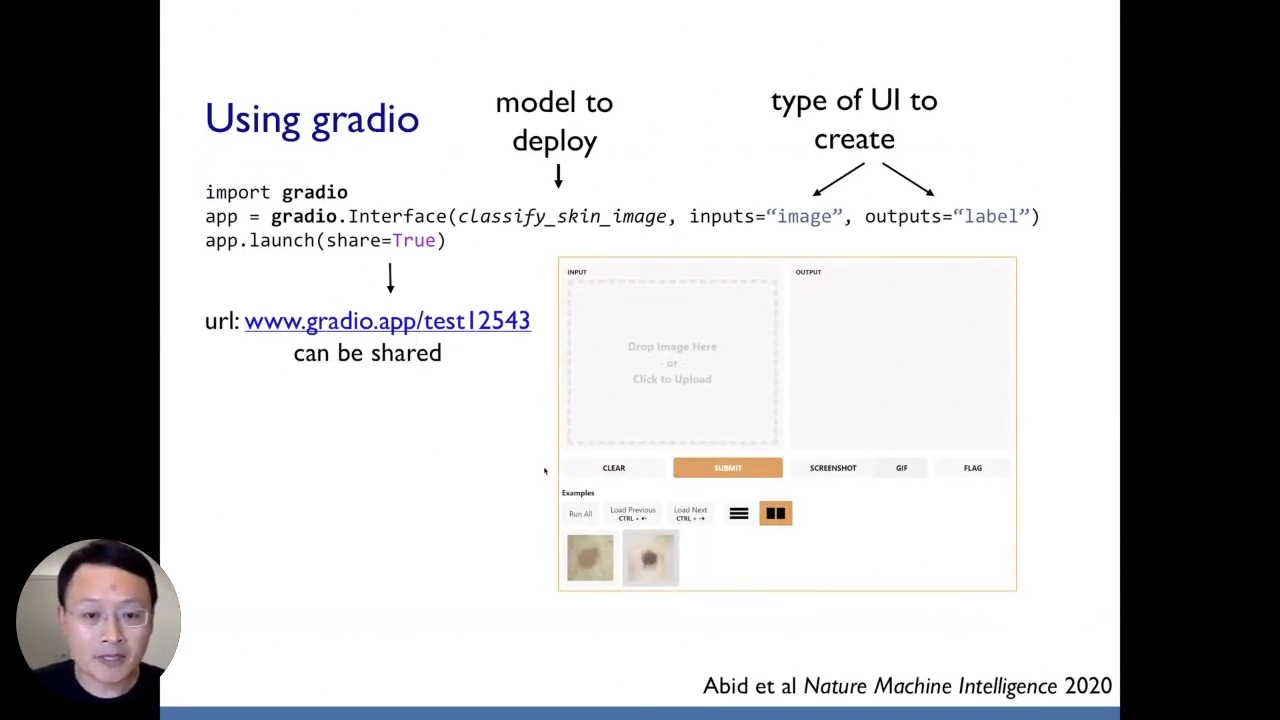
To reduce the overheads, we created one platform that can do all these straightforward steps. All of this work is managed using Python. The goal is to make it extremely easy for someone to deploy a model to collect real-time feedback. We have created a platform called Gradio. The motivation of Gradio is that for almost any machine learning model. With Gradio, we want to create a user interface for the model and start collecting feedback within 60 seconds. Gradio is super easy to work with, and it only needs Python. We can import Gradio like we import any other standard libraries in Python. Then, if we have a model that we are trying to develop, we can use Gradio to create an interface around this model. In just three lines of Python, we have created a URL, and a web interface for the model. This URL can be shared with anyone. When they click on the URL, it opens up a web interface to interact with our machine learning model. They can drag and drop their own training dermatology skin images, they can modify the images, and they can see the prediction in real-time while still in the development stage.
We do not have to wait until the model is deployed or close the end to collect real-time feedback. We can start collecting this feedback and using their data in the development stage, which is very useful for understanding these potential weaknesses or biases in the model. We use Gradio to port some of the first real-time AI trials at Standford. We are running this in a Standford hospital. All of this work is open-source. Hopefully, we have given a road map towards building up this data-centric perspective on making machine learning AI systems more trustworthy.
Now, let us go back to the dermatology AI example. Now, why did this particular dermatology AI model drop so much? If we recall, the initially reported test performance on its benchmark data set was 0.93AUC, which is quite good. However, when we tested here at Standford, the performance dropped substantially to 0.6AUC.
The first factor that we identified contributing to the model’s drop-off performance is label mistakes. We discovered that these models are typically trained on dermatologist annotations, and those dermatology annotations used to train the model came from the dermatologist visually inspecting the images. Those visual inspections can be very noisy even if experienced dermatologists do it. However, in contrast to the data we have collected at Standford, the annotations labels come from biopsy and pathologically confirmed labels. That is the ground truth.
Next, the second significant factor is the data shift. The original models were mainly trained on relatively common diseases because the data is easy to collect. However, at Standford, we had both common diseases and less common diseases in our data set. So, we cured it to be more representative, and that data shift contributed to the model’s drop-off performance.
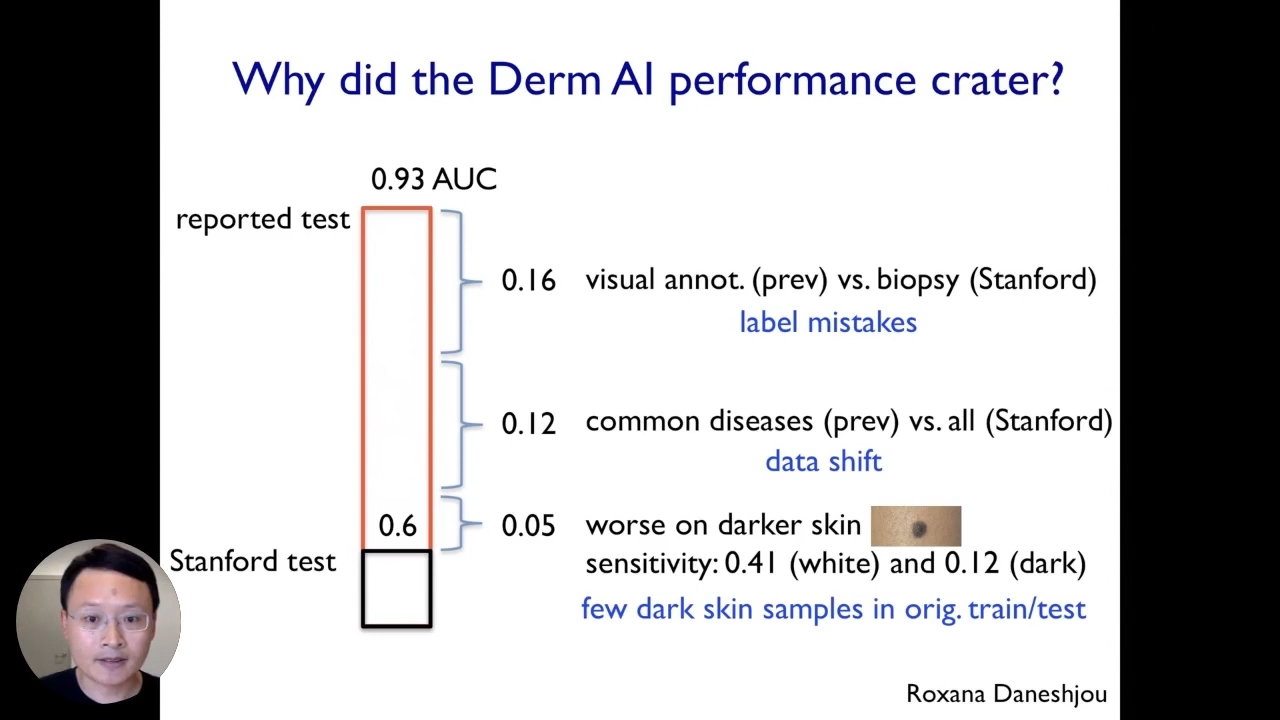
Lastly, the third factor that was also very important is that this model performed much worse on darker skin images. So, when we did our evaluation, we discovered that the sensitivity of this AI system is terrible on images that come from darker skins. The reason for that is that there are very few dark-skinned samples in the initial training and testing data set, and all three factors contribute to the model’s drop-off in performance.
Bio: James Zou is an assistant professor of biomedical data science at Stanford University. He is a faculty director for Stanford AI for health. James has received a Sloan fellowship, NSF career award, Chun Zuckerberg investigator award, and faculty awards from Google and Amazon. He has also published several research papers in top CS publications.
Where to connect with James: Website, Twitter, Linkedin.
If you’d like to watch James’ full presentation on interpretable AI, you can find it on YouTube. We encourage you to subscribe to receive updates or follow us on Twitter or Linkedin.

Team Snorkel