Peter Davio is the CTO at Black Swan Data. He presented “Petabyte-Level Learning” at Snorkel AI’s The Future of Data-Centric AI Summit in 2022. His talk was followed by an audience Q&A moderated by SnorkelAI’s Aarti Bagul. A transcript of the talk follows. It has been lightly edited for reading clarity.
At Black Swan Data, we’re a company that helps predict what products haven’t been made yet but should be made.
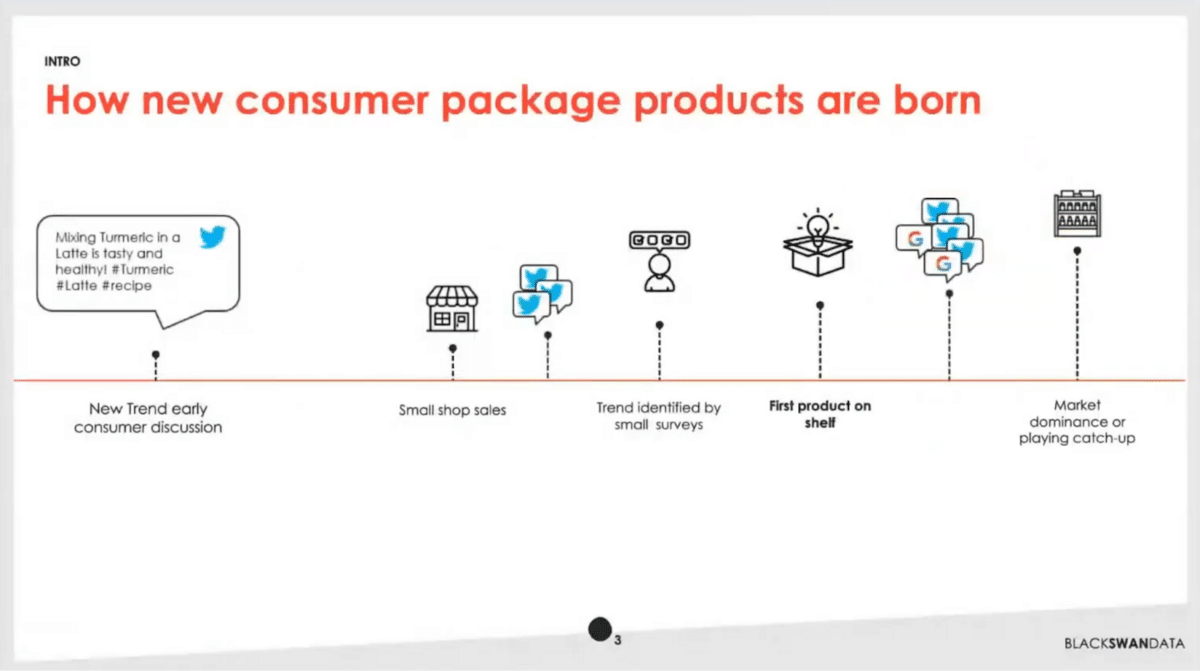
If you’re not familiar with how large consumer packaged goods companies work, a lot of times they’ll wait for certain trends to surface. Someone’s talking about, for example, a turmeric latte. They’ll start to see that, and in fact, they’ll wait for that to start to sell in small shops. Eventually, they’ll do a classic survey, so they’ll ask a small set of people, 100-500, some different questions about products they might be interested in. If they’re lucky and they jump on that trend first, then they’re first to get that product on the shelf. As more consumers get interested in that, eventually others pick up on that product. If our company has been smart enough to move first, then they’ll have market dominance—otherwise, they may be playing catch up.
We believe strongly in the principle, “the future has already arrived. It’s just not evenly distributed yet”. It’s a quote from William Gibson, a famous sci-fi author for sci-fi lovers out there.
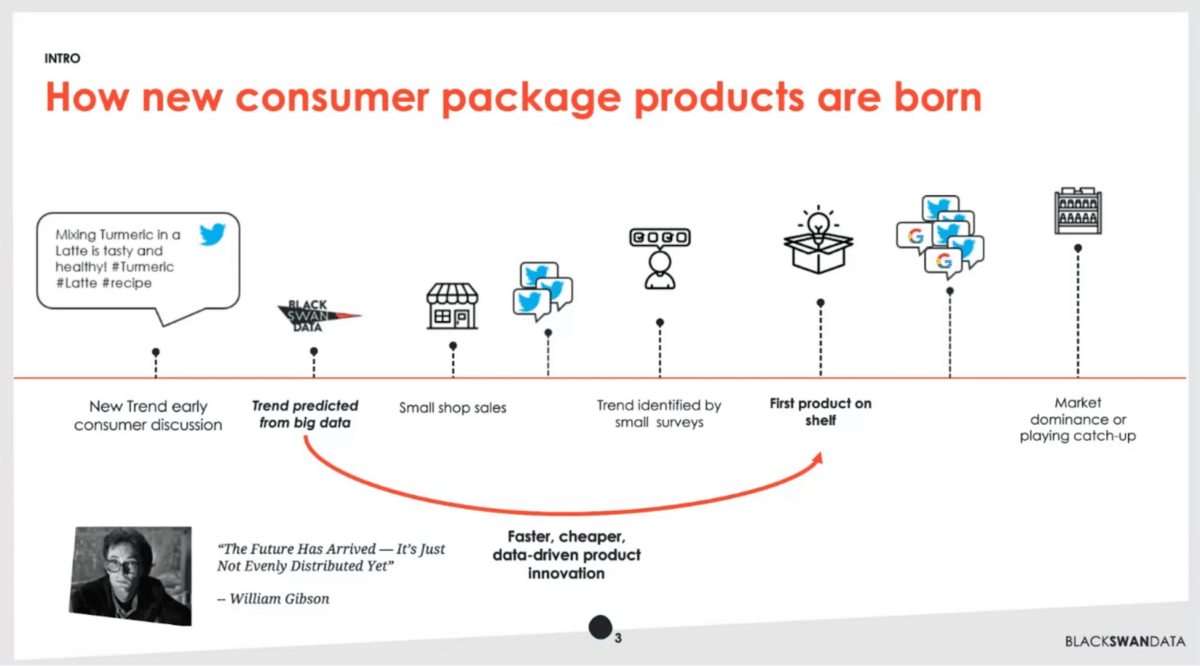
What we do is monitor all trends that we think could potentially lead to this scenario. We do that on top of big sources of data. Then, we predict which ones are going to become big, thereby allowing our clients to jump ahead into the future and be part of that first.
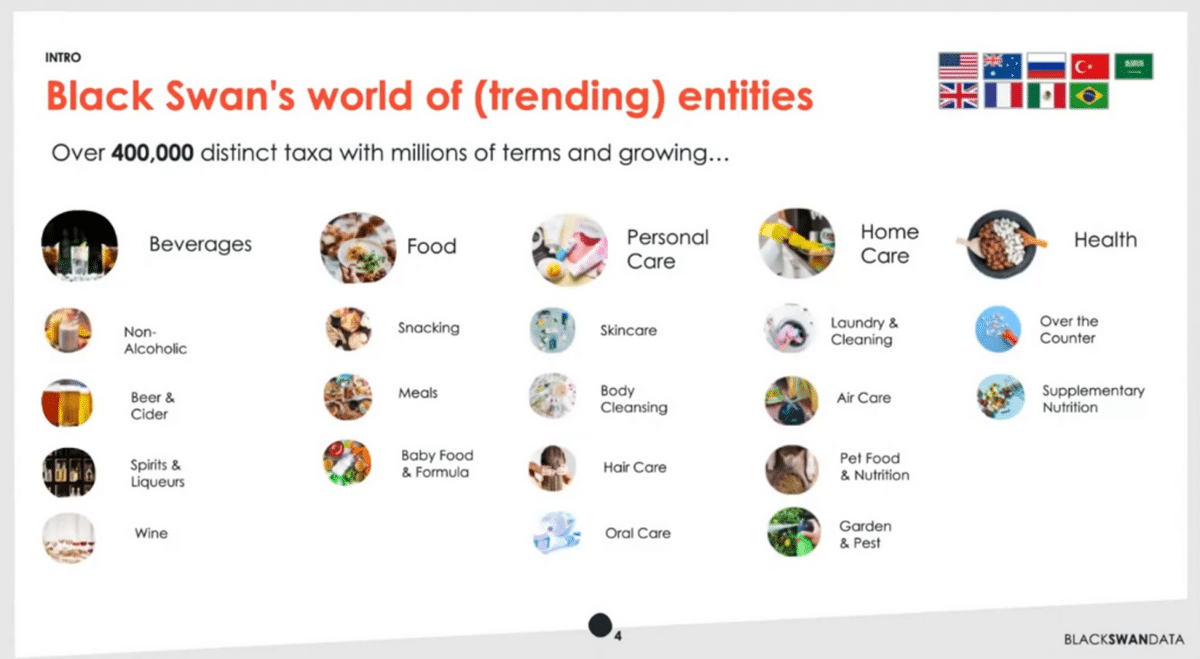
To give you a peek behind the scenes, we currently monitor over 400,000 different distinct trends. We hold them in a taxonomy or an ontology. They range across a wide set of areas. All the techniques we use are common across these different categories. We developed algorithms and machine learning techniques that work consistently across these, and they also work in over 10 languages. We do this at a pretty high level of scale.
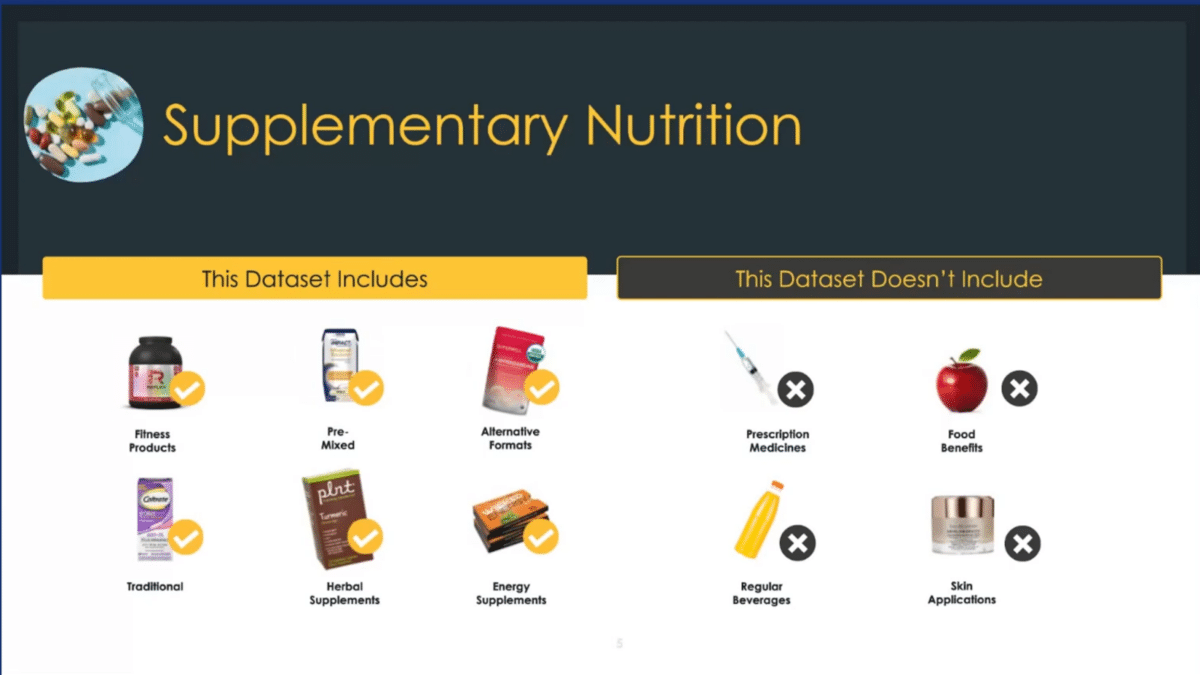
I want to give you an example of what this ontology looks like. Taking one particular category of supplementary nutrition, within that we’re trying to decide when people are tweeting, making posts, talking about different products or different needs that they want, we want to isolate those that are in “supplementary” and “nutrition”. We want things like energy supplements, but don’t think want things like prescription medicines. We’re teaching our models to make those distinctions.
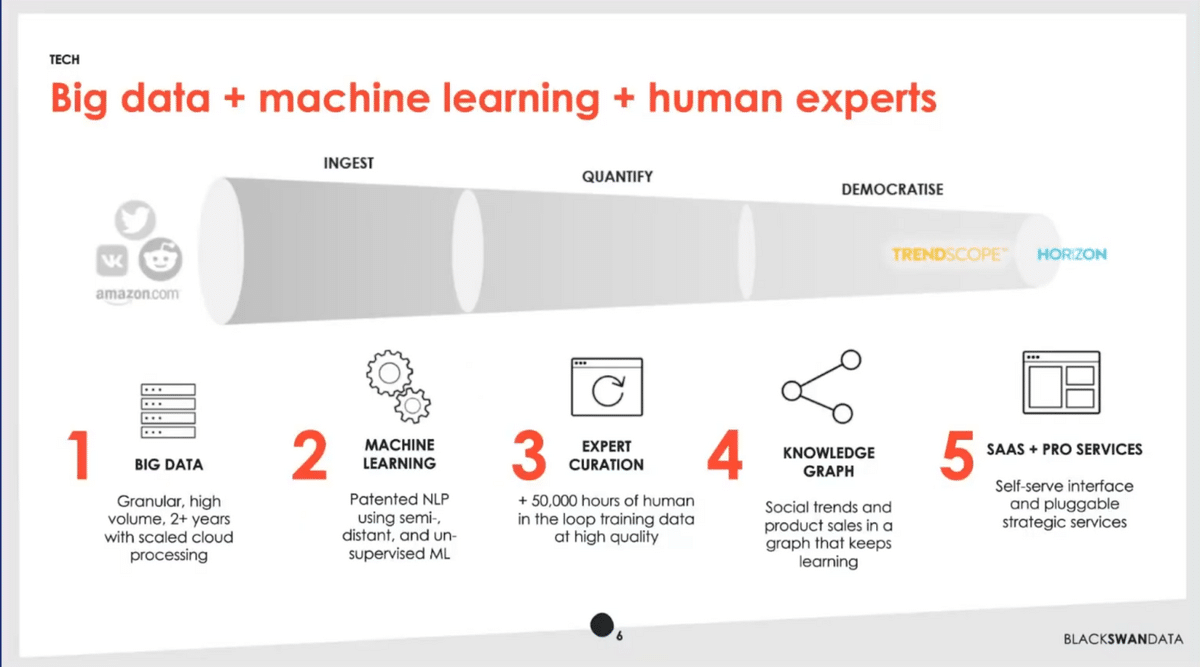
As you’d expect, we take a bunch of data, we do a bunch of machine learning. We then have humans in the loop doing expert curation. That gets put into a big knowledge graph. Then we have a SaaS-based application called Trendscope and some professional services.
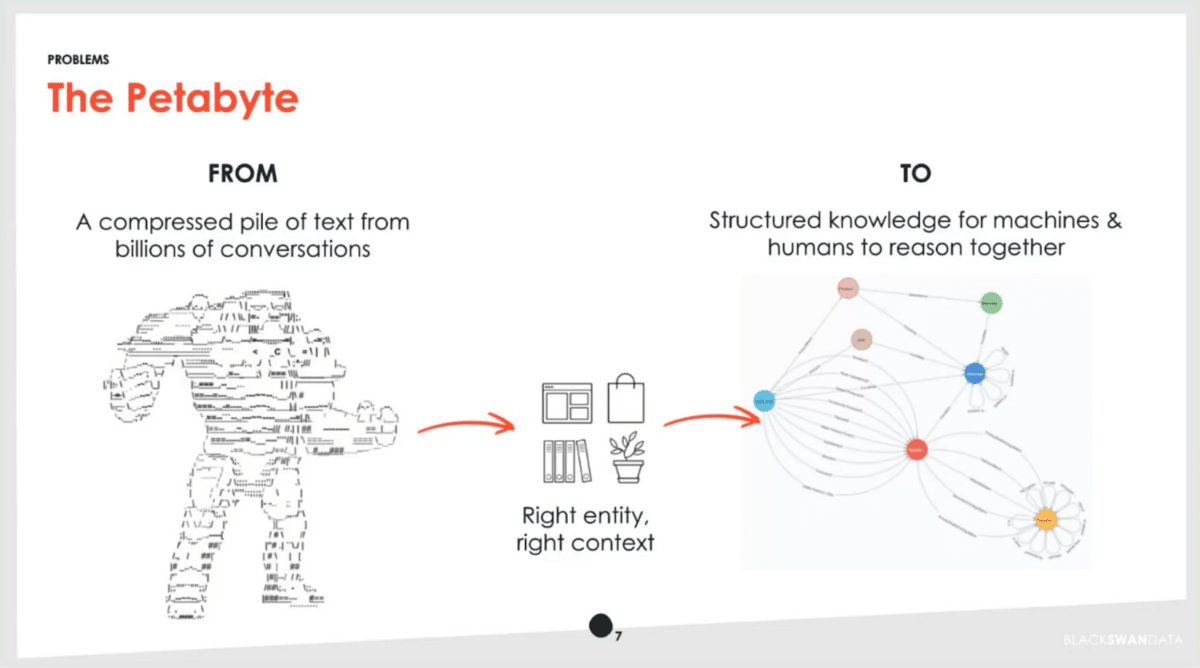
We do indeed have just a ton of information. We have over five years of data from Twitter, as well as a full Reddit firehose and a number of other data streams. Our challenge is, how do we find the right entity that people are talking about, but also critically in the right context? Once we do that successfully, it becomes structured knowledge and we can use that to make various inferences and help the right products be born.
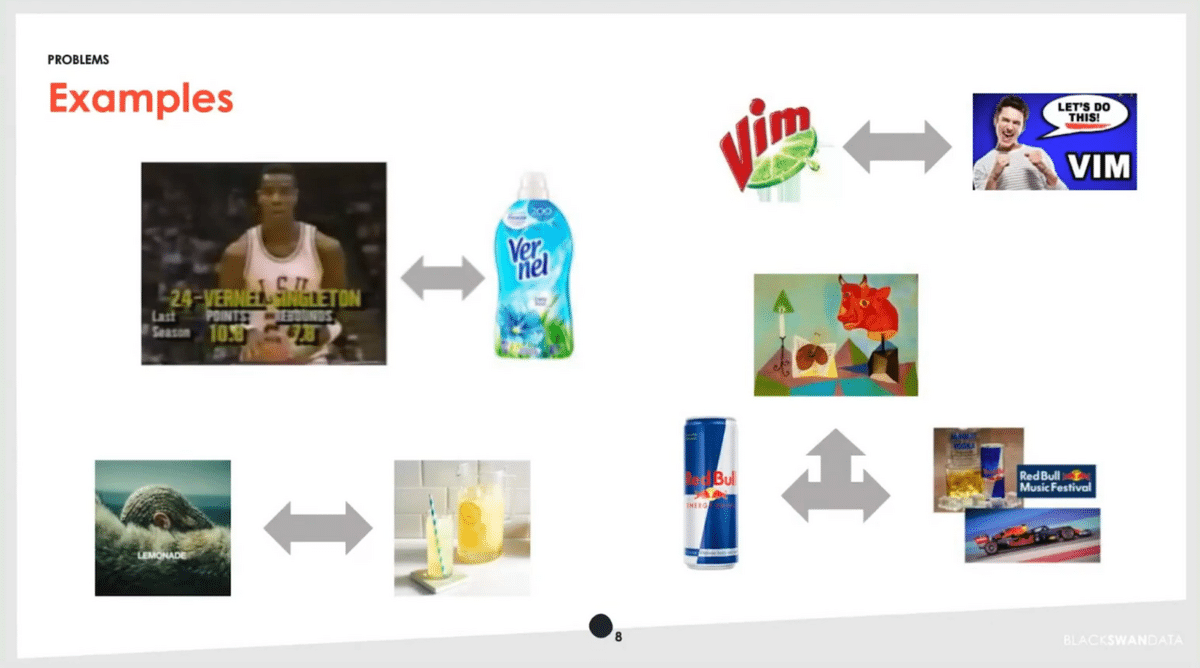
There are a number of fun disambiguation problems in this dataset. Both a basketball player and a product share the name Vernel. When Beyonce released her album Lemonade many years ago, people were, all of a sudden, talking about lemonade a lot—but of course, they weren’t talking about the entity that we cared about in this case. Red Bull is an interesting case since we want to track it as an energy drink, but they also sponsor sports events so it appears there. And then, of course, there’s the classic Picasso painting with the red bull. There are also incredibly ambiguous brands like Vim that come across in phrases like “vim and vigor.”
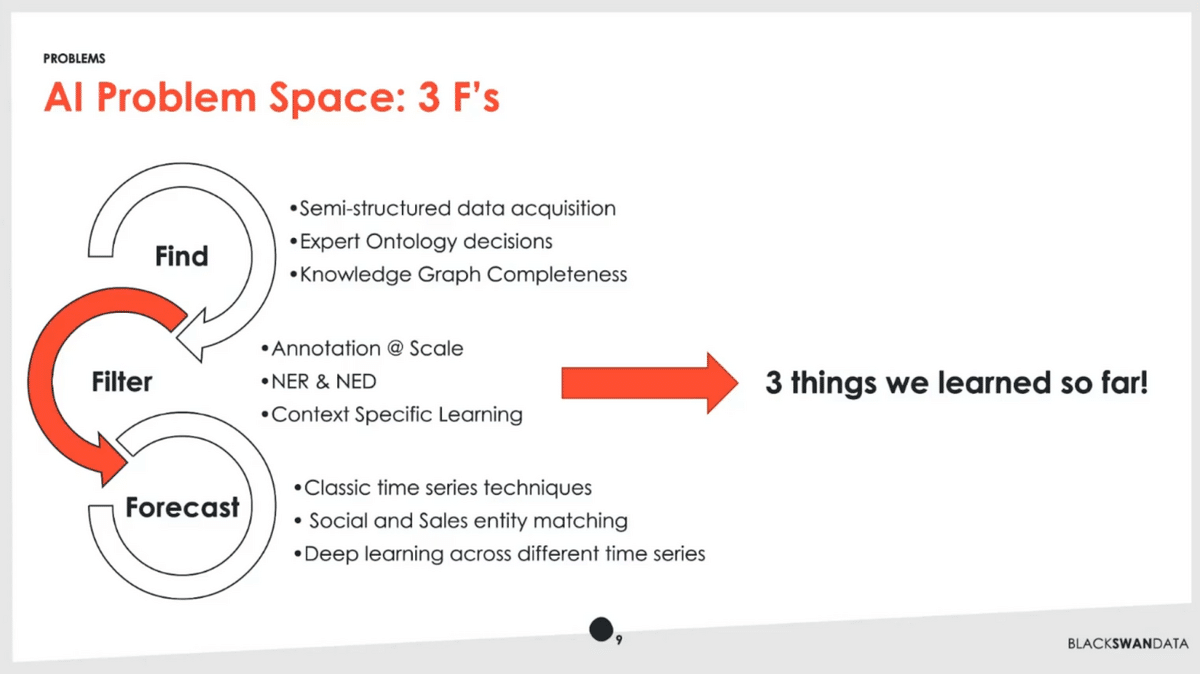
As we think about our different spaces and we’re solving problems, we break them down into the three F’s. Fundamentally we’re finding information. As many folks at this conference have talked about it’s semi-structured, so we’ll be taking data from all different sorts of places from pure unstructured consumer conversation to partial ontology that exists in different places—things like Wikipedia, etc. We’re then making a number of expert decisions with our in-house team. Then, we are able to use techniques and solve important problems like knowledge graph completeness and other things.
At the other end of the spectrum, we’re doing forecasting. In some sense it’s very classic—time-series analysis. We do some interesting analysis, matching up topics that are discussed on social and the actual products that end up selling with their features and benefits. Recently we’ve had a lot of success applying a deep learning technique called TFT, temporal fusion transformers, in that space.
I want to talk about this hard area in the middle (Filter). We’re doing data annotation and it has to be at scale. We have the NER & NED problem, the named entity recognition, and disambiguation. Then, we’re trying to do learning in the space of specific contexts. I’m going to share three lessons we’ve had over the last six months.
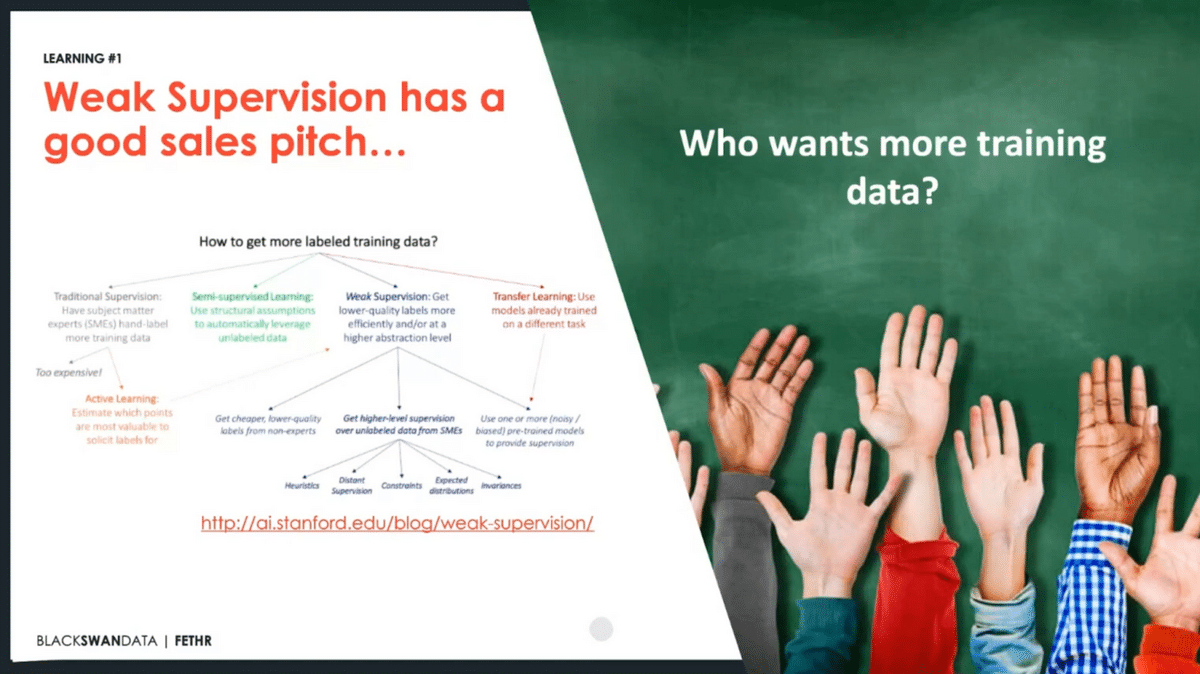
First—obviously, weak supervision sounds fantastic, right? Who doesn’t want more training data? I’ll take more training data. None of my data scientists would turn that down. When you read the background, it seems like we’re missing out on this whole paradigm of AI, this whole different learning technique.
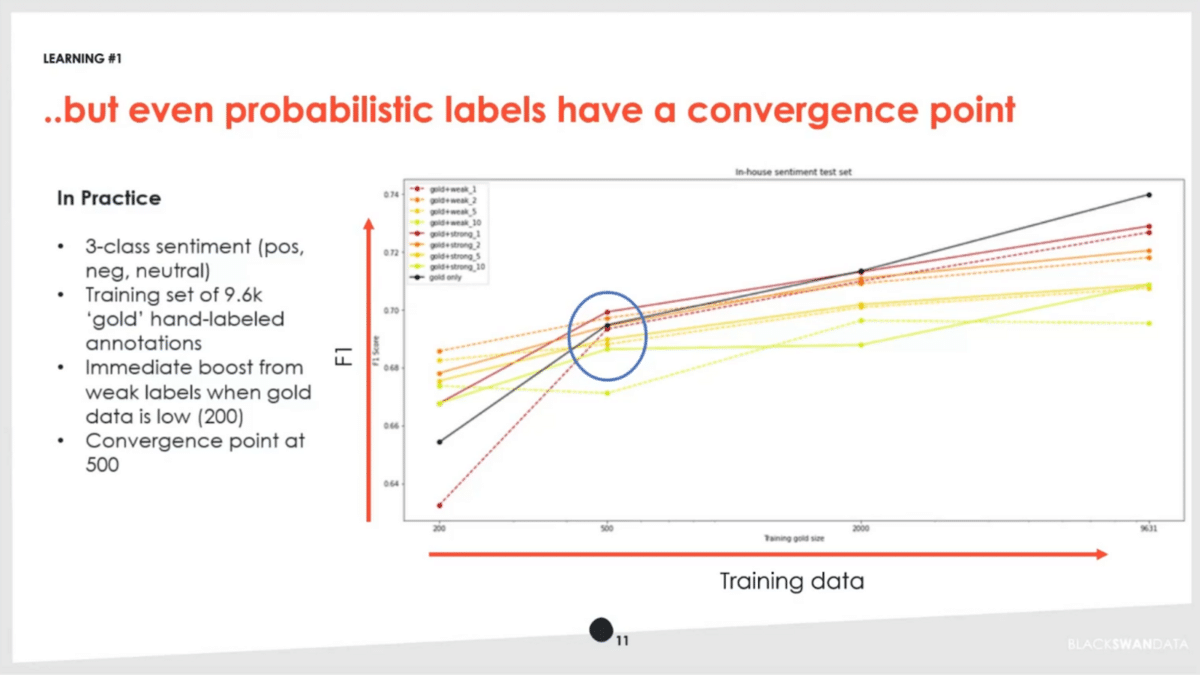
While a lot of that is true, in practice you have to look at the data. The whole technique of probabilistic labels revealed some interesting things to us. We’re looking at a classic sentiment analysis. We have our own in-house sentiment model where we’re predicting whether things are positive, negative, or neutral about a particular entity. We collected almost 10,000 annotations that we consider the gold standard, of high quality.
Here’s what we actually saw—increasing training data as we go from left to right, and our F1 score in terms of accuracy. We used what we call our gold data, our original trained data that we spent a lot of effort on. Then, we used various weak versions and we did them in different combinations, at different confidence levels as well, just to understand the raw effect.
What we found was interesting. Getting weak labels out initially gives you a really good boost. That’s particularly valuable in scenarios where you don’t have a lot of training data. It’s certainly better than when you can’t get more labels, but in some cases, you can. Going from 200 to 500 training data examples put us right smack in the middle of determining whether it was worth it to use a weakly-supervised technique to generate these probabilistic labels at this point.
As we go further, the black line is us continuing to apply more gold label annotations. At a certain point, we see that start to over exceed in terms of performance of what we can do with the weak label. The new label slows us down or introduces a problem at a certain scale. Depending on the data scenario you’re looking at, the classic lesson applies—no free lunch. You may run into real-world scenarios where it matters whether or not you’re hitting or surpassing this threshold.
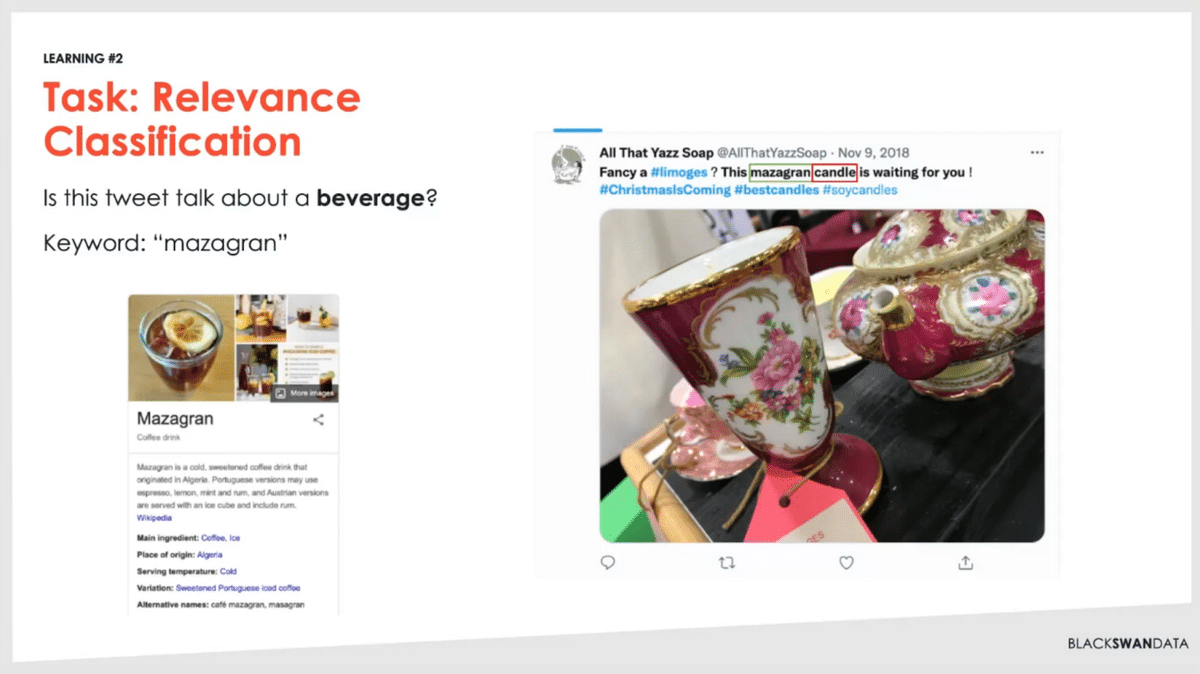
Learning number two. We’re trying to make different classifications, so here’s an example. In this scenario, we’re using some of those techniques of asking large language models doing Q&A prompting. In this case, we filtered down a set of documents that have the word “mazagran” which if you didn’t know (I certainly didn’t know) is a coffee drink. It should be relevant.
But then, we’ll come across documents like this. It has “mazagran” in there, that’s accurate. It even has this other term around pottery, so if you looked at the image, even you’d say it looks like someone’s talking about a beverage, something they drink. In fact, we see that they’re talking about a scented candle. This should be something where we say no, this is not relevant for what we’re talking about. If it’s a candle, we have a whole other data set of air fresheners and other things that this would be relevant in.
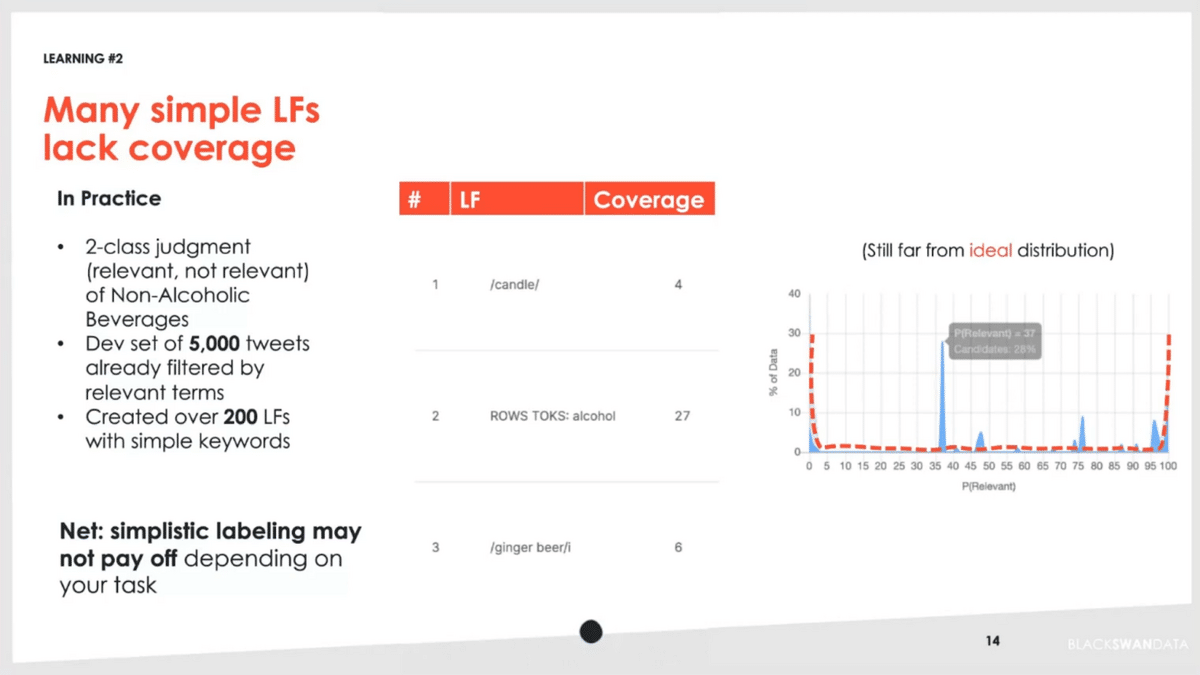
The learning we had was that we thought, in some ways, that we could just apply a lot of very simple language labeling functions against these. We took a dev set of about 5,000 tweets. We created over 200 of these different labeling functions. One here is where we’re capturing “candle”, and that covered four occurrences of the dev set we were looking against. You can see other ones where we’re trying to exclude things like alcohol and ginger beer. We end up doing over 200 of these.
On the right-hand side is the probability distribution—were we able to actually make progress on this? As you can see in the middle, we weren’t able to push out that distribution and get the classic U-shape that you’re looking for. In this scenario, we found that it was taking too much effort to get that overall payoff.
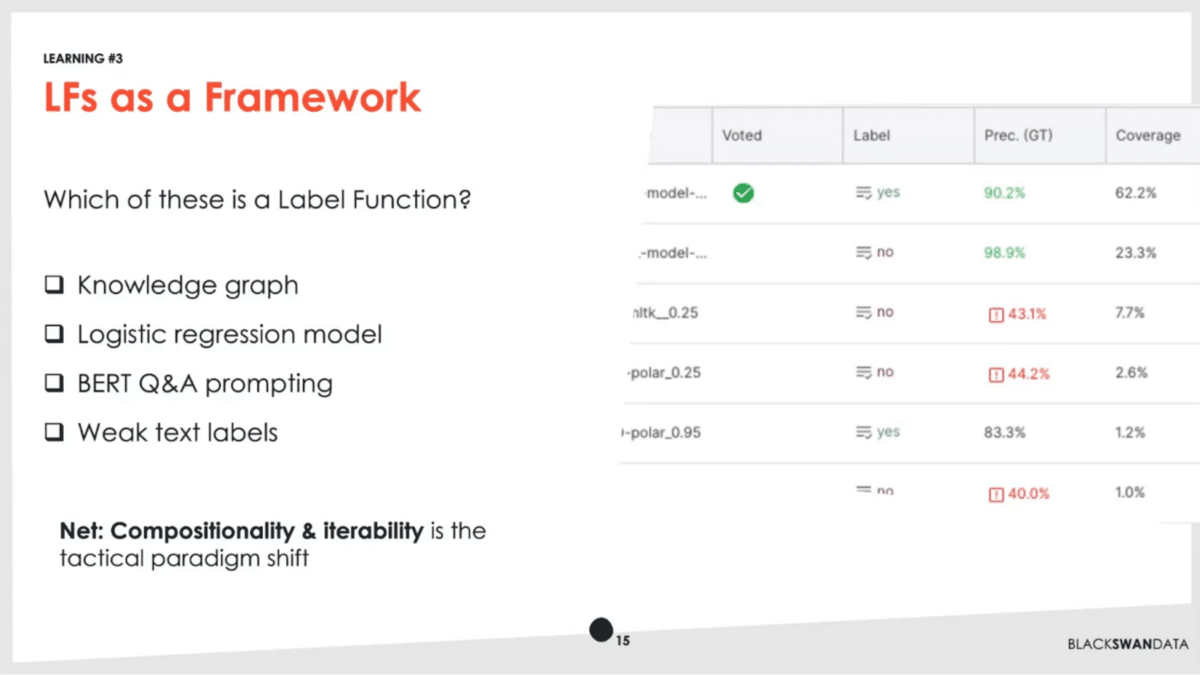
That leads us then to our final learning. It was to remind ourselves that labeling functions aren’t just one example or one class. It’s actually a framework to plug in different organizational resources. Knowledge graphs, existing models, as simple as they might be like logistic regression, some of the more advanced techniques like Q&A prompting—all that ties together. Ultimately, what we care about is being able to observe those things in a uniform fashion, and understand where we’re making the right decisions and where different modeling techniques are learning correctly.
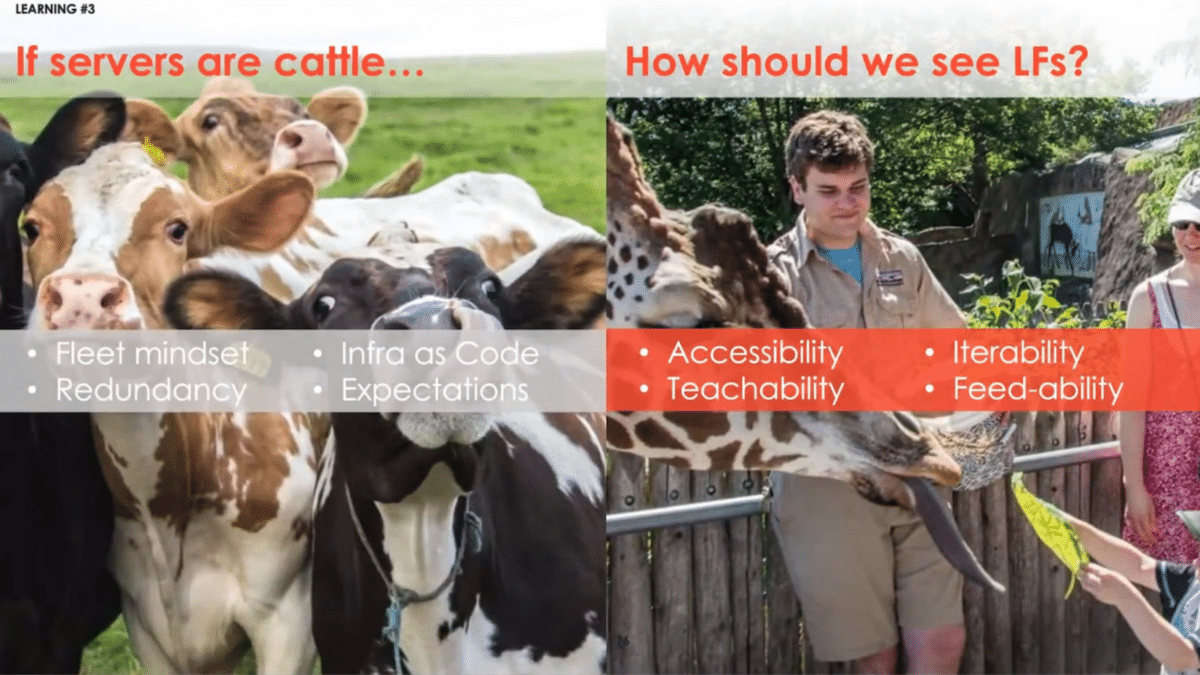
I have a brief analogy that I shared with my team to drive this home. For those of you who’ve been in technology, you may have heard this phrase, “don’t treat your servers like pets.” Don’t be precious about an email server that’s up—you should have a lot of them and you should treat them more like cattle. We know at the end of the day that there are expectations that cattle may not live forever. There have been different movements in the industry around making sure we have lots of scalable, redundant things. We have a fleet mentality. Ultimately, even infrastructure is code, so we can redeploy entire services and failover events.
There’s a similar paradigm shift here around label functions. Why don’t we treat them like animals in a zoo? We don’t necessarily want to send our precious models to the abattoir, but at the same time, we do want things out of them. We want them to be accessible. We want to be able to teach them, to iterate on them, to feed them more data. Ultimately, it’s not just a data science task, but we want human experts to be able to engage in them as well.
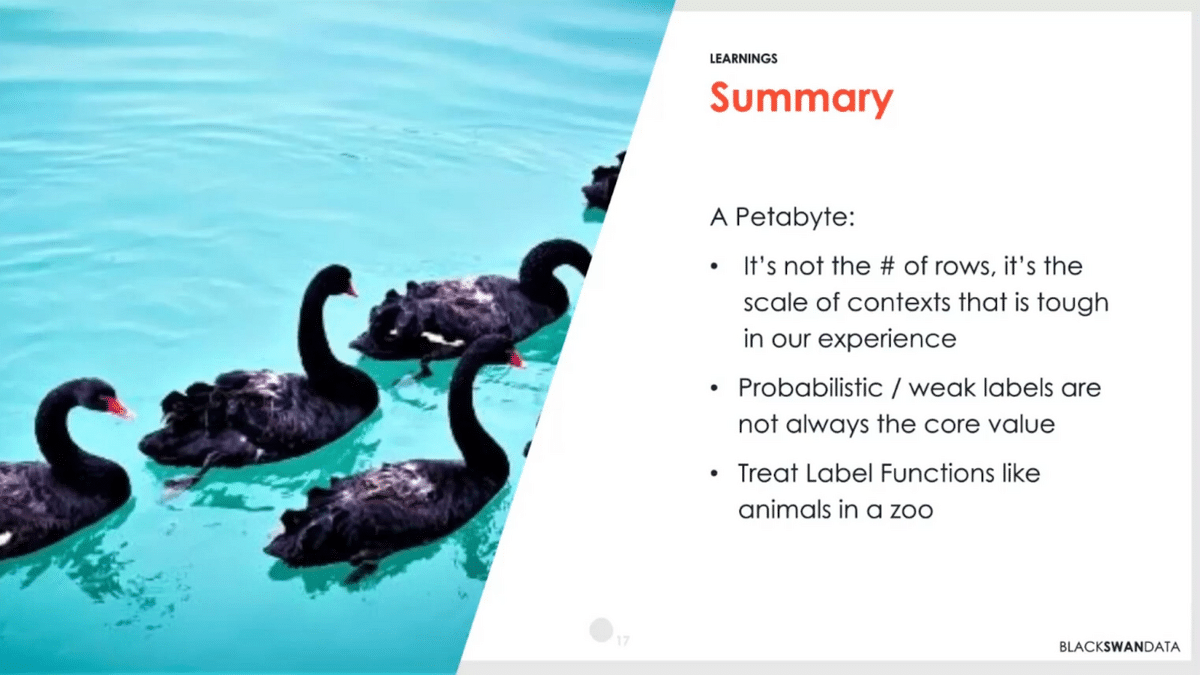
That’s my parting thought here. Treat your models and all your other labeling function assets as something that you can put in an open spot and that you can monitor how it’s working and critically you can look at the data to see how it’s working as well. That’s the petabyte that we have here at Black Swan—it’s not how big it is, it’s how many contexts it has that makes it tough.
Q&A with Black Swan Data CTO Peter Davio

Aarti Bagul: Peter, thank you so much for that great talk. It was very informative in terms of both the problem that you’re solving and then learnings in terms of the real world, using labeling functions in the learning sphere.
You laid out the overall process that you’re working through, and then the specific labeling problem that you’re tackling. How does the labeling problem that you solved trigger downstream processes? What specifically is the problem here, and then how does that tie in?
Peter DavioI. We’re learning to make different distinctions between some of these classes. Ultimately we have to figure out if someone’s talking about any one of these potentially hundreds of different thousands of different items, are they actually talking about something, say a non-alcoholic beverage that actually fits in one of these categories or not.
That’s where we have to learn lots of really small decisions, almost small model learnings, as opposed to just training a big classifier that makes five or six decisions.
AB: Got it. More composable components, many different models being chained together for this final task, and the insights that you’re providing.
Could you explain more about what you mean by composability and interoperability? I’m assuming that’s related to your last learning about labeling functions.
PD: When we think about composability, it’s how can we train one model that does really well in one area. For example, irrelevant speech we often get is things talking about sports—there are lots of sports players with names that may overlap different brands we’re tracking. There, we think about training a model where the job is to detect sports analysis. It can score a lot of our different documents and say, aha, I think this one is actually about sports. Then we could compose that with other category distinctions that we’re making. Being able to see how those things operate independently gets us out of having to create the one magic mega-model that that’s perfect at everything.
AB: You talked about like the sentiment piece as well as the different topics that you’re talking about. I thought the disambiguation problem was interesting—you might not know if it’s talking about Vim, it could be talking about many different things or the many different examples that you gave for Red Bull. Could you quickly talk about some techniques that work well for this task?
PD: In a lot of ways, this is data science 101, so there are lots of different techniques in named-entity recognition. One of the big things we do is use our knowledge graph to boost awareness of that. If we detect other entities in a document we’re talking about, we can use those as supporting evidence to say, yeah, we’re speaking in the right context there.
There’s also, as we look at things in the embedding space, there’s enough differentiation within the underlying data. Say, this discussion that’s much closer to things like sports is differentiated from this one where people are talking about energy drinks. These are some of those things that become clear in vector space.
AB: The composition of the topic of the tweet and all the different models that you’re building around, i.e. what is the tweet about, would also help for the topic that would then disambiguate what the entity is about as well, so the entire system comes together.
How long did it take to develop this? How did you think about building this entire system of composable models and what the plan was just starting from scratch?
PD: We’ve been hard at work on core parts of this for about three to four years. As with anything we started with a more simplistic model. Originally, it was a simple taxonomy that lacked real understanding of, say, a food item has different ingredients and it gets used in this scenario.
We’ve matured to the point now where we have it stored in a formal graph structure. To the question around knowledge graph-building techniques, a lot of times it is deciding that high-level structure and figuring out whether there are certain nuances you’re trying to make that actually aren’t gonna be realistic in the real world.
We do struggle still with supplementary and nutrition. People often say, I drank this beverage that was good for me, and then I also took this extra pill. It’s in both discussion points there, right? You need to decide when you hit a certain threshold and put it in one or the other, or just allow for a certain amount of overlap.
AB: You’re working with such a large amount of data, that petabyte-level learning, so how do you even identify and deal with ambiguous data that cannot be resolved? Just the scale that you’re working with, how do you know when you’ve hit diminishing returns? How do you explore that remaining data?
PD: Part of that is what we’re still exploring in data-centric AI and trying to actually set the thresholds. We’ve pushed this model as far as we’re gonna get it without us investing a bunch more human time, so ultimately we’re guided by rough accuracy levels and coverage levels. As we look across these different domains, we can understand what we can reasonably get things to. We can also detect outliers. We can say, wow, these ingredients that we’re looking at in pet food seem to be quite different from the other data sets we have. Why is that? Let’s go investigate that. A lot of times it is that, having some standards and trying to measure everything by that.
AB: Given that your taxonomy’s so large, to get those accuracy and precision numbers, you have to label a large amount of data, like across each category, right? How do you do that initial validation and dataset creation?
PD: It’s a good question. Classically, we’ve gone all the way back to shipping Excel files around. We don’t have people who speak 11 different languages, and oftentimes we are working with third parties around that. Right now we’re actually in the process of our second loop of formalizing the process, making sure we’re using APIs and consistently updating our annotation data monthly. It’s still a challenge I would say.
AB: One last question. What are the challenges that you get at the petabyte scale, that you’re seeing at your level working with this much data, that people may not have considered that are tricky open problems that you’re exploring?
PD: Outside of the standard problems of having enough compute resources, one of the classic ones is deciding when to discard some things that you’ve learned, or when you’re st storing too much information. Having a data retention policy and being okay to let some data go is probably the hardest thing that you need to do. Once you get into that frame of mind then, if you are gonna retain extra information, it has to have a clear purpose and it has to have a pattern for how that’s gonna scale in your architecture. It’s always a difficult decision. No one wants to throw data away, but at the same time, you have to pay AWS at the end of the day.
AB: Along those lines, storing the right amount of data, but then also knowing if there are new categories popping off, if you need to retrain that data, that whole loop, especially with your taxonomy, I’m guessing it continues to update. Any thoughts there in terms of how you’re tackling that as well? Getting these labeling functions working, maintaining these models, setting up a retraining monitoring schedule, and things like that.
PD: For a lot of our data searches, we can always go back and re-query, so it’s not the biggest problem. We’ve optimized that part of our platform, so it’s easy to go back and get more data, even data that we decided to let go earlier. I think the retraining question is a big and interesting one. We probably do it less now than we would like to in the future. As we get into our MLOps, that tends to be when we notice problems, as we’re analyzing things as opposed to seeing shifts in a regular fashion. Definitely not a solved problem yet.
AB: Makes sense. This was incredibly enlightening in terms of the problems that you’re solving, how you’re solving them, and the learnings that you’ve had. Thank you so much for sharing that and being with us here today.
PD: Awesome. I’m excited to hear how other people have solved these problems as well!
Catch the sessions you missed!
The Future of Data-Centric AI 2023, our two-day free virtual conference, brought together thousands of data scientists, AI/ML practitioners, researchers, and the AI community at large to hear about and discuss the latest trends and research in data-centric AI. If you registered for the event but didn't see all the sessions you wanted, you can now catch up. The recorded sessions are available for registrants at the same Zoom portal as the live sessions.

Recommended articles
View all articles

JudgmentBench: Comparing Rubric and Preference Evaluation for Quality Assessment
At our latest Snorkel AI Reading Group, Russell Yang (AI Engineering Fellow at Stanford Law) stopped by our San Francisco office to present JudgmentBench: Comparing Rubric and Preference Evaluation for Quality Assessment. As AI models improve at open-ended tasks, the field faces a harder problem: how to measure quality in domains where ground truth is contested. Two paradigms dominate: rubric-based
June 18, 2026
•

The Art and Science of Building AI Benchmarks That Shape the Field
Vincent Sunn Chen spoke at AI Engineer London about what it actually takes to build AI benchmarks that move the field forward, not just measure it. The throughline is an asymmetry that keeps showing up across deployments and the 150+ proposals reviewed for the Open Benchmarks Grants: agent capabilities are climbing fast, but the ability to measure those agents with
June 16, 2026
•
Snorkel Team

Cua-Bench: benchmarking computer-use agents on professional software
TL;DR We built a benchmark of 25 expert-authored KiCad schematic-editing tasks and ran a frontier computer-use agent against them. The headline numbers: 1. Why build a computer-use benchmark for electrical engineering? Most computer-use benchmarks today live in the same handful of apps: web browsers, file managers, generic productivity suites. Those evaluations are useful, but they share a structural weakness —
June 15, 2026
•
,

