Jacomo Corbo is a Partner and Chief Scientist, and Bryan Richardson is an Associate Partner and Senior Data Scientist, for QuantumBlack AI by McKinsey. They presented “Automating Data Quality Remediation With AI” at Snorkel AI’s The Future of Data-Centric AI Summit in 2022. Their presentation was followed by an audience Q&A moderated by Snorkel AI’s Aarti Bagul A transcript of his talk follows. It has been lightly edited for reading clarity.
Jacomo Corbo: I’m one of the co-founders and chief scientist at Quantum Black and partner at McKinsey. I’m joined by Brian Richardson, who’s an Associate Partner, and Senior Data Scientist at Quantum Black, and also leads our data-centric AI efforts across Quantum Black and McKinsey globally.
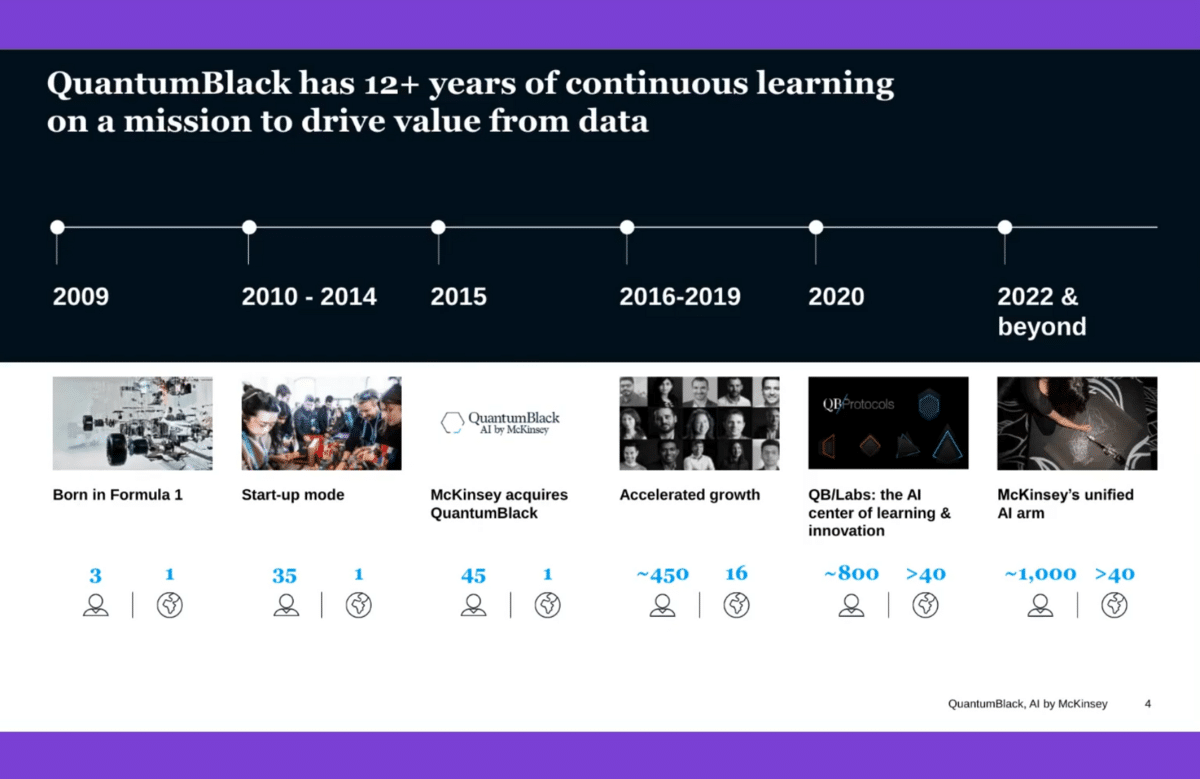
By way of explanation, Quantum Black is a machine learning engineering services company that started back in 2009. Myself and two co-founders all had ties to F1 teams—we’re very lucky that Formula One teams were our anchor clients when we got going. We started working more with advanced engineering manufacturing firms in the first few years and started working with McKinsey, first in semiconductor manufacturing. We were ultimately acquired about six-and-a -half years ago now, at the very end of 2015.
The last few years have been something of a scaling journey. One of a few milestones was setting up our product engineering arm, QB Labs, towards the latter part of 2019. Now, we’re very much an integrated part of McKinsey’s overall analytics and digital practice, but we have more than a thousand technical practitioners globally. One should really think of us at the level of doing the technical implementation work around designing, developing and operationally deploying data products and services that use ML.
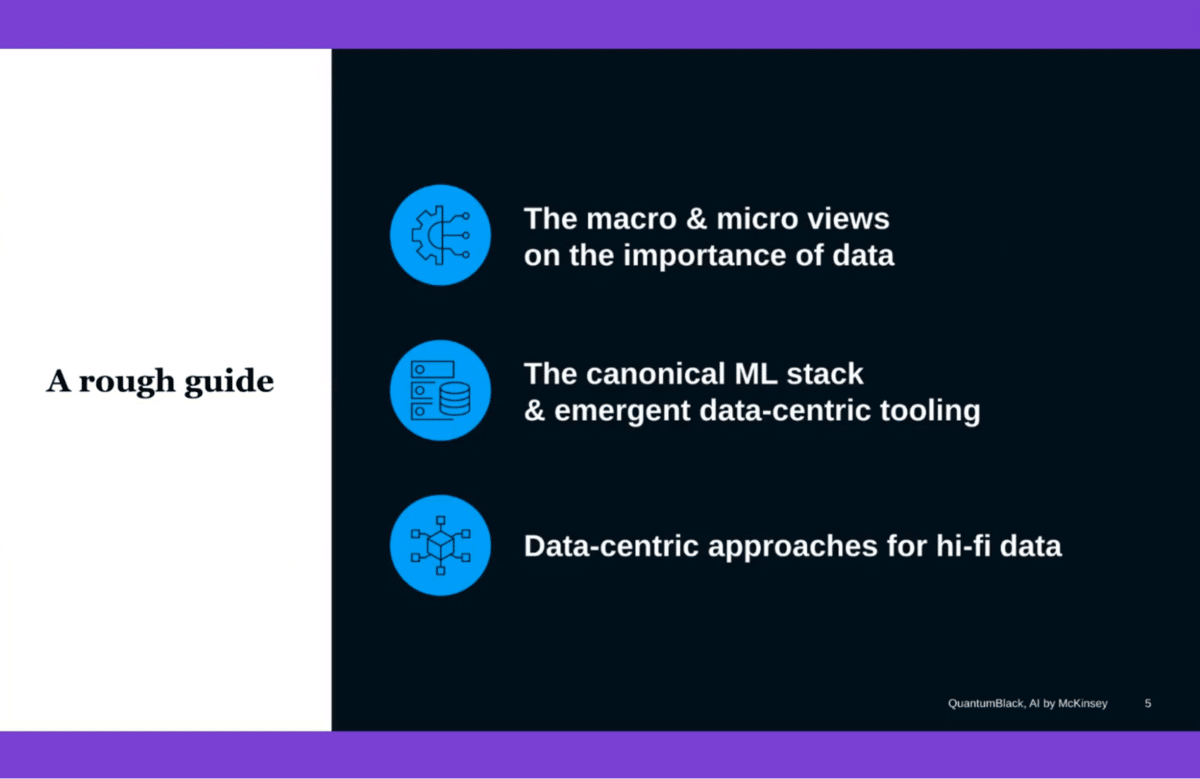
I’ll give you a rough guide to what we’ll talk about—in the first place, a very macro and micro view of the importance of data. The macro view will not be surprising. The micro view has things specifically related to our own experience in the space which I think are interesting, given some of the scale that we have right now, not only the breadth of settings at the level of functional domains but also application areas and sectors that we see.
We’ll talk about some of the things that are changing—development and deployment practices for ML, and specifically some of the things that are emergent around data-centric tooling.
Then, Brian is going to walk us through some tooling that we’re focused on very specifically related to data quality. This is one of a number of tools and assets that are meant to help development teams and engineering teams that are looking to build ML products and operational ML products.
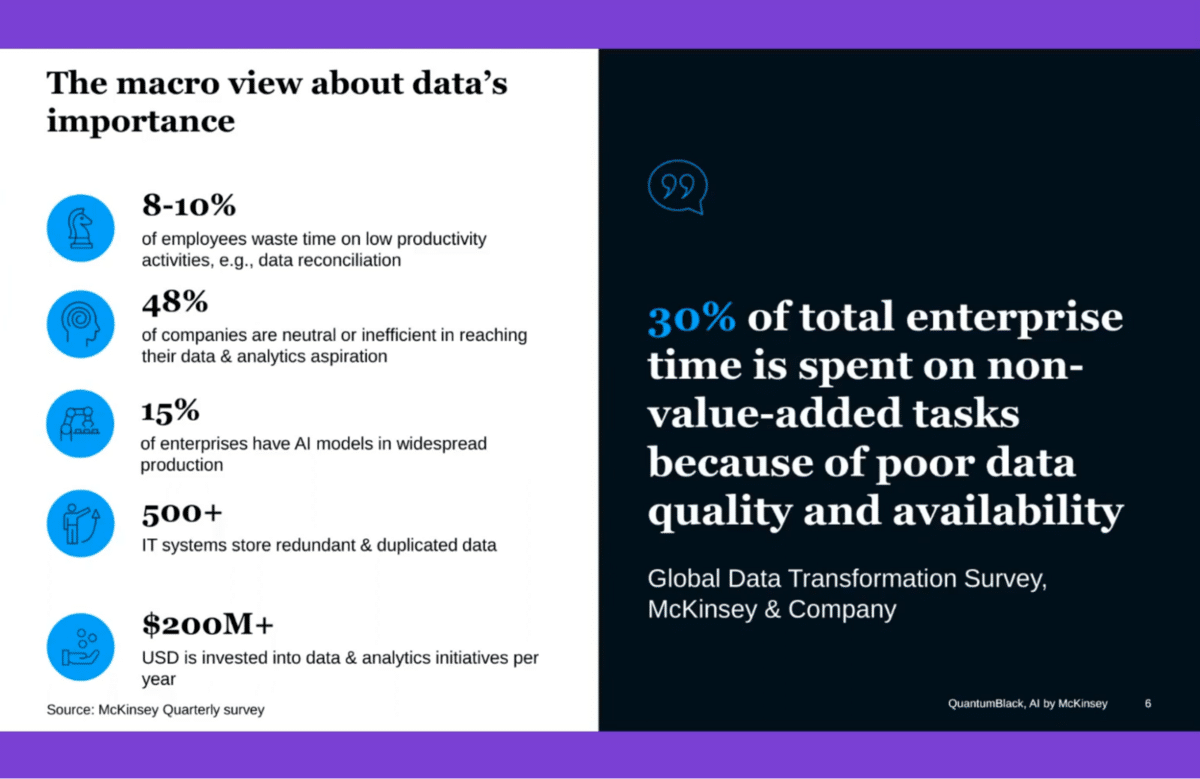
This is coming from McKinsey’s quarterly survey and McKinsey’s data transformation practice and Global Data Transformation Survey. A lot of the statistics here will not be surprising to many of you, and this is very much a cross-sector global view—how much time and effort, and resources ultimately that are expended within enterprises around data, maybe relatively low value-add data harmonization reconciliation tasks, things that are trying to contend with and wrestle with poor-quality data.
This goes hand in hand, at least in our experience, with the statistics that around 15% of enterprises have ML models in widespread production. One of the big failure points, or one of the big complexities of deploying anything into production, is tied to data.

In the last 12 years, how we build and how we do the work that we do has changed quite a few times. I think we’ve learned quite a few things, but this is very much still evolving quickly.
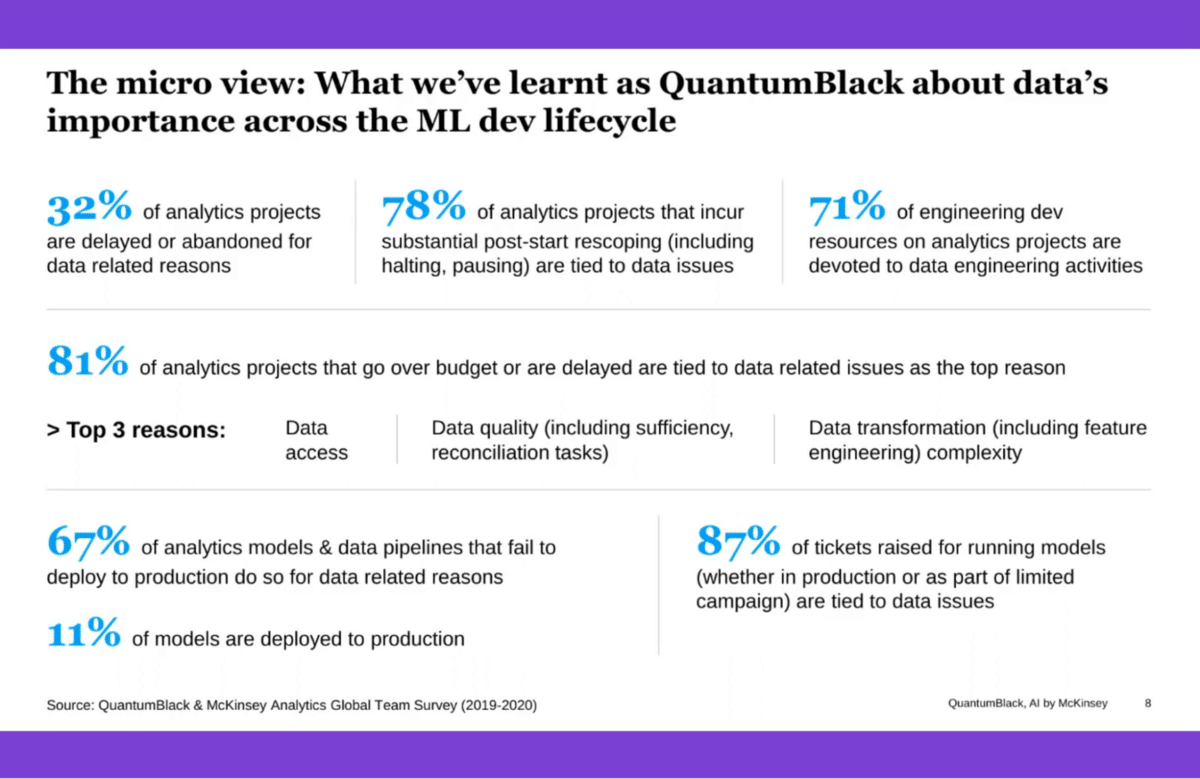
Here’s a little bit of our own perspective, and things that we’ve surveyed from our own teams globally. Everything that we’re seeing here is tied to statistics that we ran back in 2019 and 2020—so it’s a couple of years out of date, but I think the numbers here apply very broadly and aren’t just reflective of our own experience but are interesting to bear in mind. They give you a view of the importance of data across the entire life cycle.
On the one hand, you’ve got a third of projects that are either delayed or abandoned—think of any number of use cases that are not broached and ultimately don’t come to fruition because of issues tied to data. Of those that start, you still have 78% of those that go through substantial re-scoping. That includes deferring part of the implementation and halting projects outright tied to data-related issues. That is the top reason for post-start re-scoping in our experience.
After we get into the engineering complexity and how teams operate during development—and we’re talking about analytics projects, which may be worth defining as things that involve building models, but they could also be at the level of running complex exploratory analysis and even at the level of building complex data pipelines that will end up in a view of that data that could land in reporting. It’s a superset of everything tied to building models, but things that are tied to building some category of a model—whether that’s an econometric model, whether that’s a machine learning model, which is the largest share of those projects.
So, in those projects, you have more than 70% of the engineering development resources that are tied to data engineering activities. That is a mix of data engineering, feature engineering work, a mix of data transformation work writ large. It is at the level of data quality and joining tasks. A lot of the things that we’re seeing around data, whether it’s a feature store—a specific component within the ML dev lifecycle that’s increasingly known, understood, and adopted, but in a lot of enterprise contexts, is really tied to the 71% figure. People are trying to amortize the high cost of engineering tied to analytics development in general.
Then, we’ve got a little bit more than 80% of projects that are massively over budget—the top reason being data-related issues, but among the top three reasons we have data quality and data transformation complexity being two of the top three.
Further down the life cycle, we’ve got only 11% of all projects that are in widespread production. In our case, of the projects that we begin, about 11% of those ultimately find their way into production. It’s a very low pass rate, and 67% of those fail because of issues that are tied to data. For things that sit in production and things that are tied to exception handling and issues that are raised by these models, you’ve got almost 90% of those tickets that are, again, tied to data-related issues. All of this reinforces the importance of data-centric tooling.
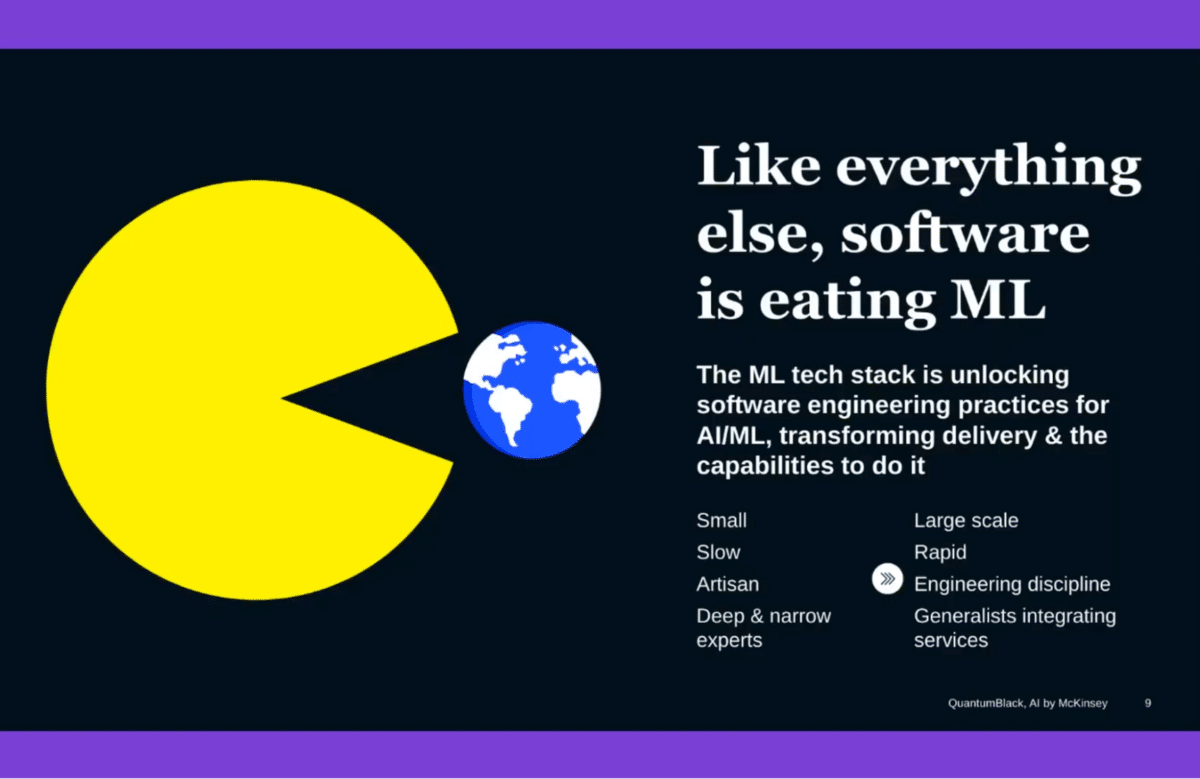
We are starting to see something of an emergent tech stack, which is very quickly changing how we think about doing ML development and deploying ML models, monitoring them, and sustaining them as operational capabilities and products.
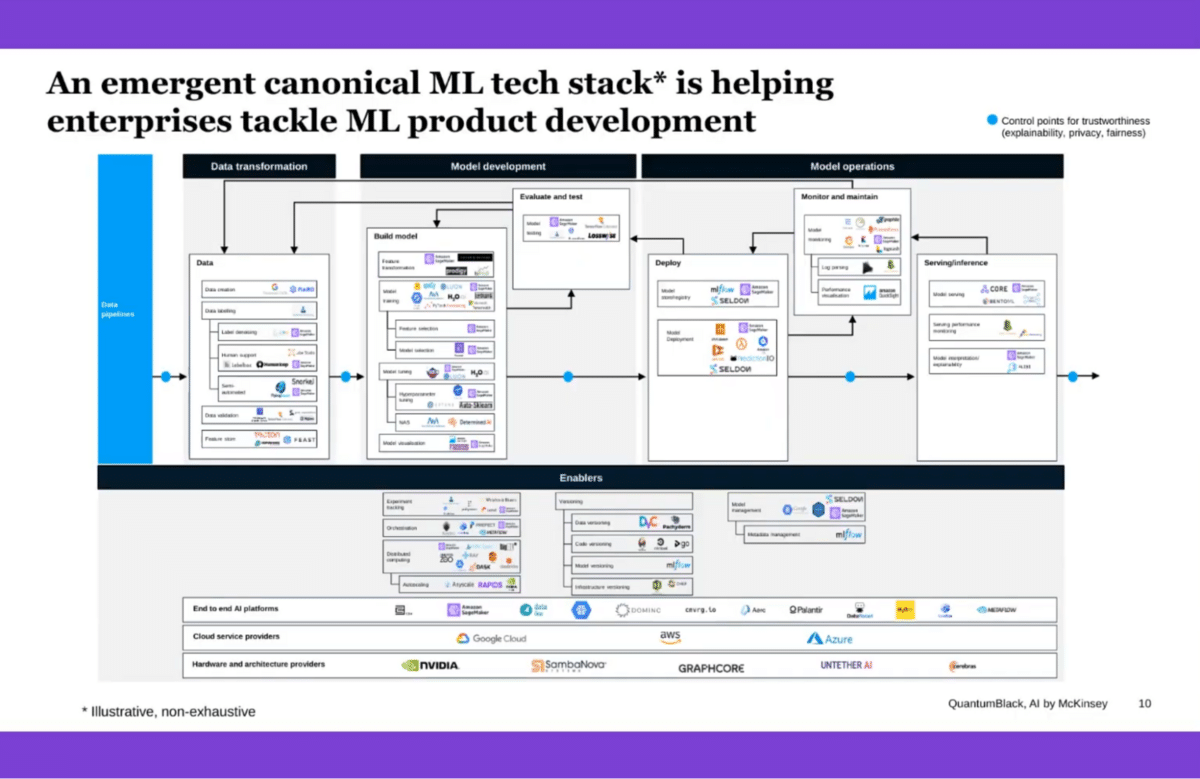
This is by no means comprehensive, these are just some of the workflows and tools that are making their way into different parts of the life cycle. All of this is to say that around everything to do with data—and some of that might be the upstream work, but some of that is closely coupled to what happens in model development and in model operations—we are starting to see more and more highly specific tooling that is meant to address some of the issues.
This is something that is still very much emergent, even at the level of how these things fit together and situate themselves in a development workflow, in part of the life cycle. That is still in flux and being worked out. Brian’s now going to walk us through things that are specifically tied to tooling that can help address data quality pain points.
Bryan Richardson: Great to be here and to meet everyone. I’m an Associate Partner and Senior Data Scientist with McKinsey Quantum Black. I focus on building data center tooling for our team and our clients.
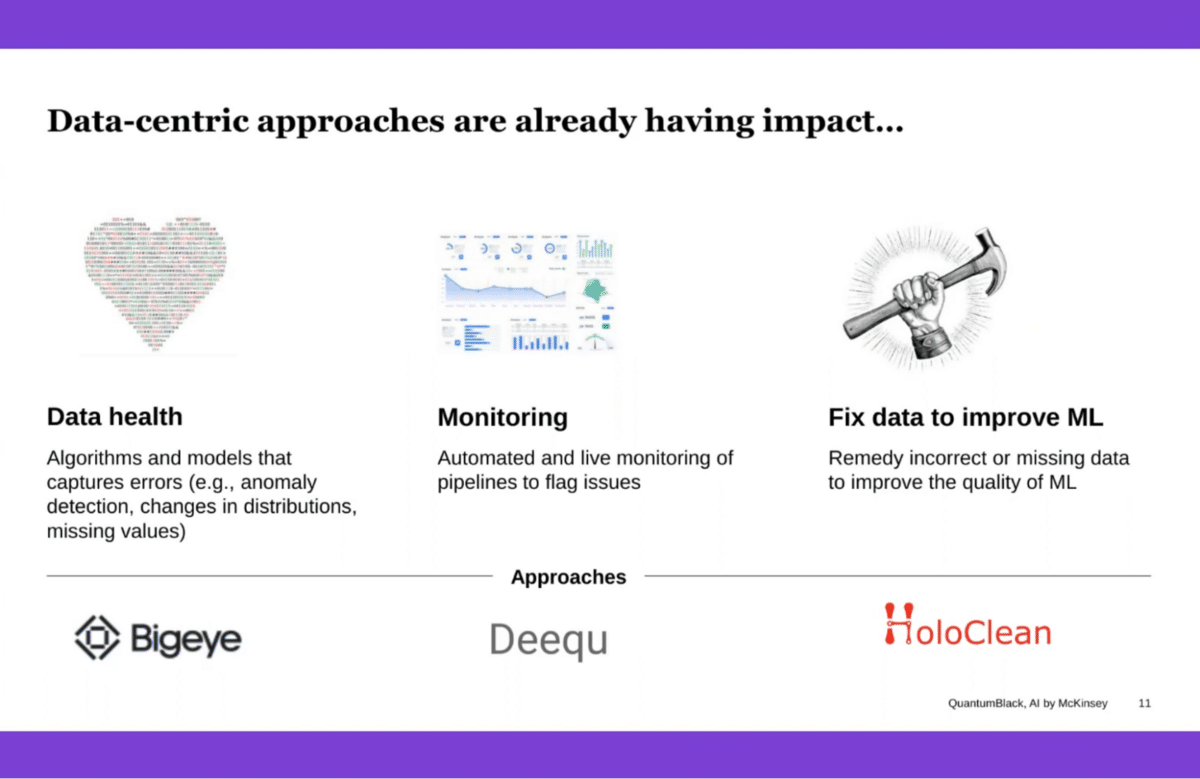
What we’re seeing is that data center tools are having an effect today, from health, to monitoring, and increasingly fixing data quality for ML purposes. Tools like Bigeye, Deequ, and HoloClean are leading the charge here as we see the shift moving from data health and data monitoring to fixing data on the right side—changing data to improve ML and to improve operations, there are definitely risks.
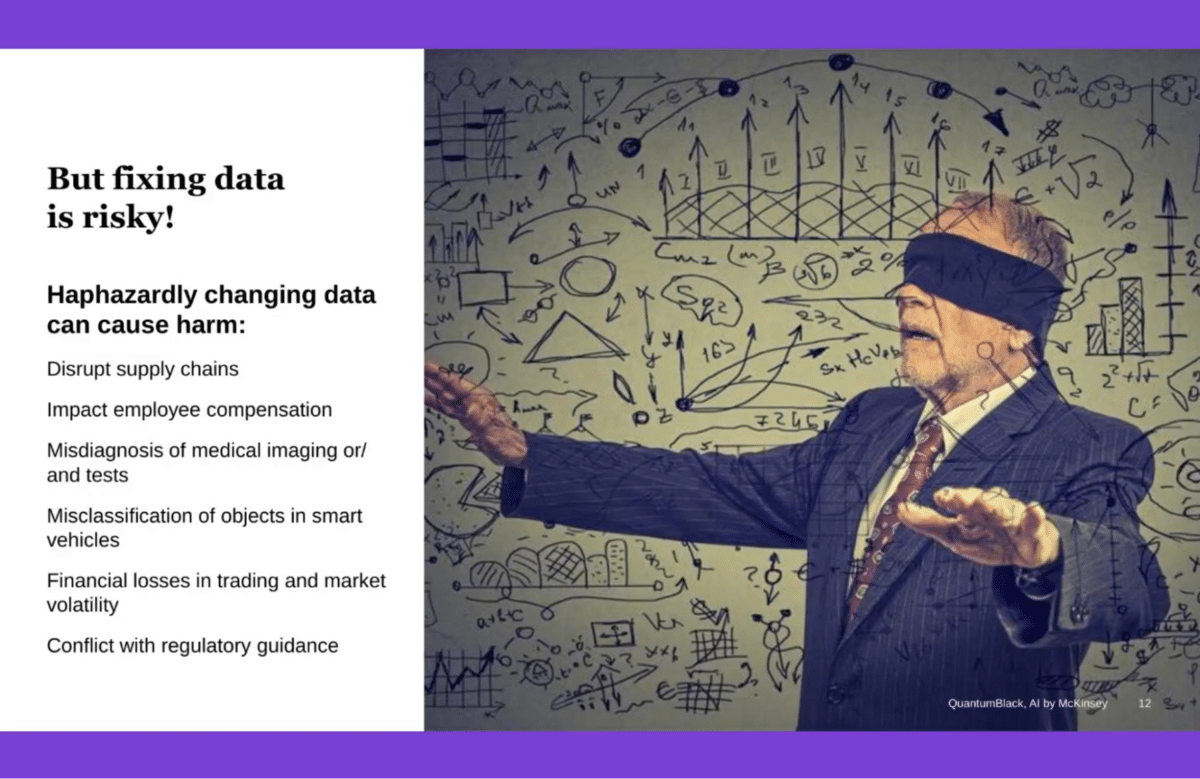
Changing data to drive model development or for operational purposes can cause harm, whether it be changing product hierarchy data that can impact people’s compensation, changing supply chain data that can disrupt shipping lanes, or, in one case, figuring out how space stations communicate with the ground station and using AI approaches to improve their quality of data. Increasingly, regulatory guidance is also becoming an issue.
This is all to say that data-centric AI is very important. We’re seeing it being used more and more to improve and change data. But the risks are real, and governance is critical to this process.
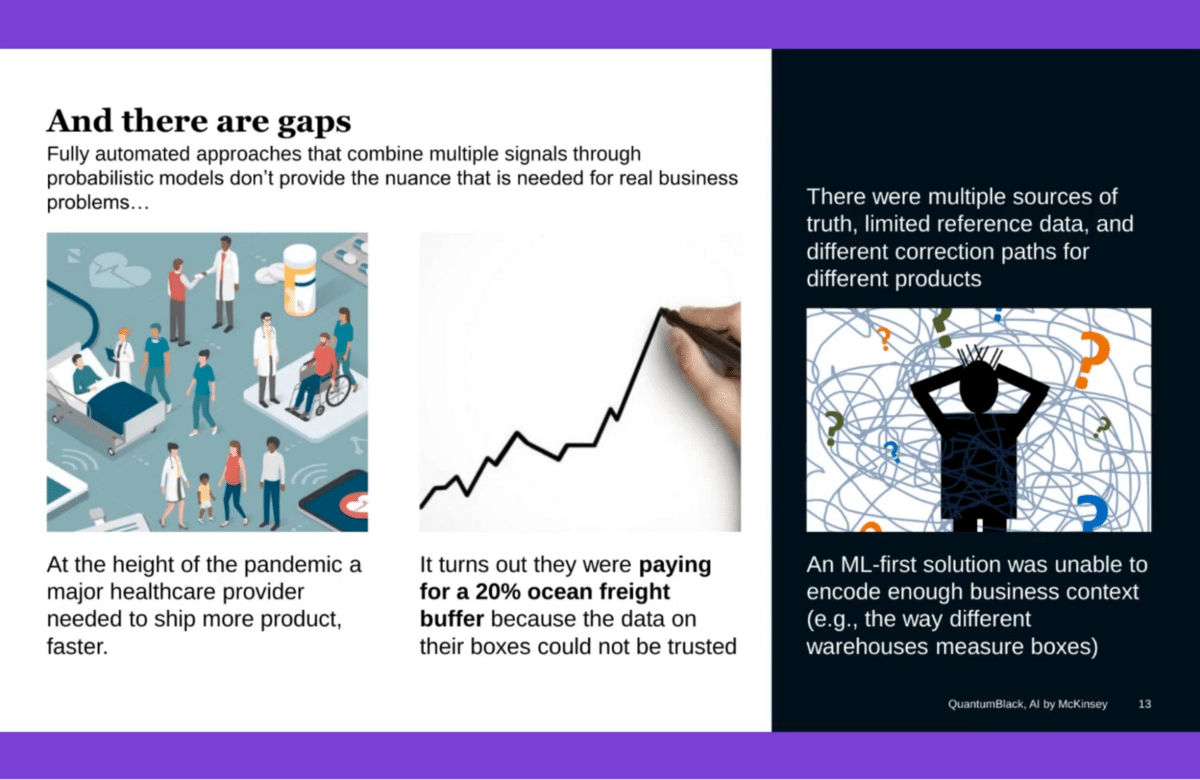
Some of the gaps that we’re seeing with data-centric approaches are that, even if you’re able to automate through probabilistic approaches or through machine learning-based approaches like HoloClean, is the improvement of data quality—oftentimes, those black box ML approaches just don’t work as well. You’ve got to translate those changes into explanations for a business user.
For example, one of the clients we work with had pretty significant problems with their data on their logistics and their supply chain. We needed an approach.
We had to use ML and data-centric approaches like weak supervision to improve the quality of their data in a way that was transparent to users, transparent to the business, and could be tested at the warehouses. Transparency is a critical ingredient in improving the quality and changing data through automated approaches. ML-based approaches that we’ve seen for businesses are very hard to get across the line.
So, how do you tackle this? Where do we go next? Can a data-centric approach help? The answer is that (I’m sure this group is well aware)…
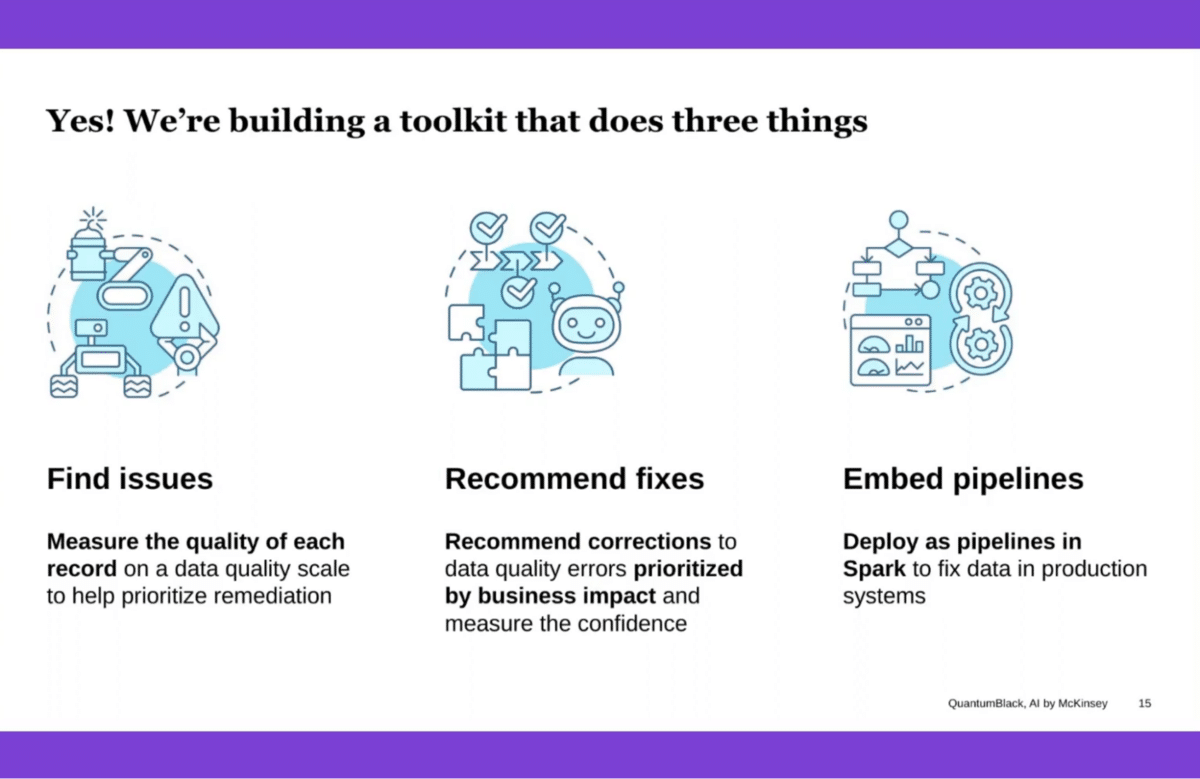
Yes! Most, most definitely. We’re building a toolkit at McKinsey QuantumBlack that is designed to do three things for clients, and in a very transparent data-centric approach that shifts the burden from validating data at the back end to incorporating their input at the front end.
The first is finding issues, so automatically detecting issues in datasets. That’s easy and uses contextual-based anomaly approaches.
The second and then third, which are probably the most important and newest approaches, are recommending corrections. We’re building tools and algorithms and an orchestration layer to be able to automate the process of recommending corrections to problems, explaining why those corrections were recommended, giving a confidence of both the correction and the error, and using that to create a feedback loop for users and experts to improve the quality of data in a way that, once that approach is built to fix data, we have a pipeline that can be deployed in enterprise-grade systems like Collibra, SAP, etc. The idea is that you’re able to automate this process of recommending corrections and embedding them because, in the past, there was no shortage of tools that could find a bunch of issues and bury you in problems (which wasn’t very helpful).
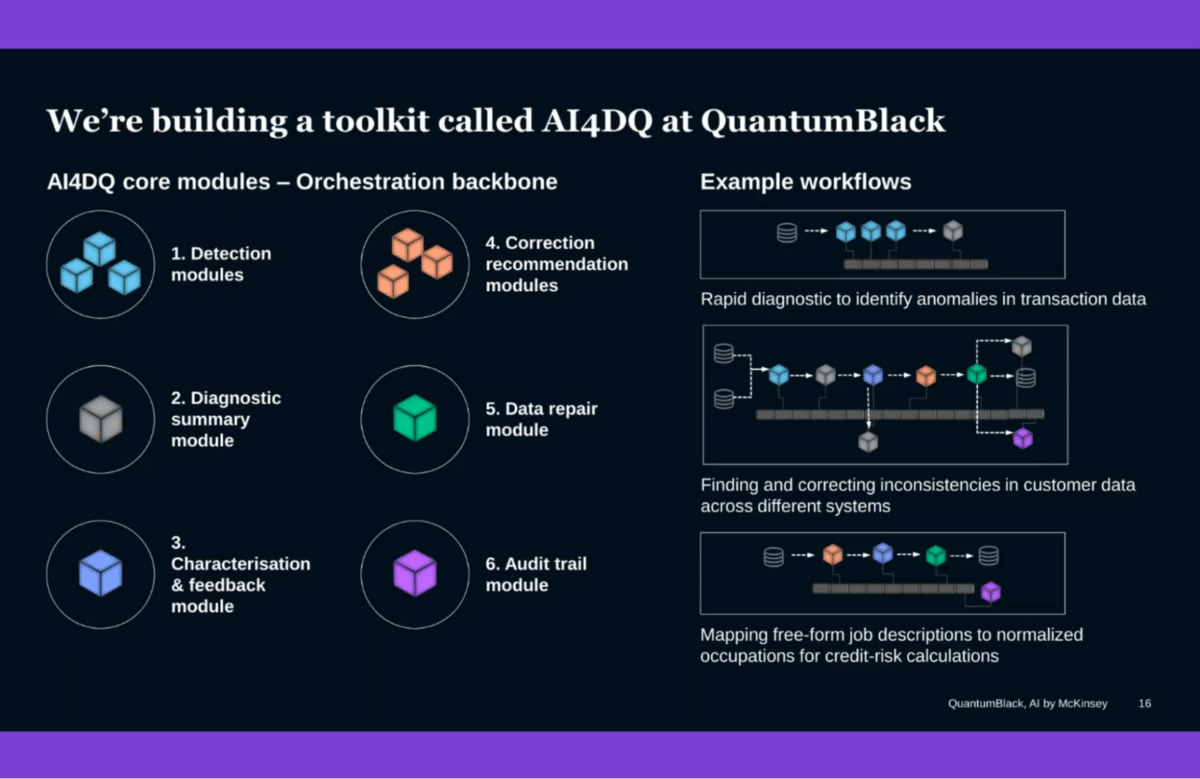
What we’re building in QuantumBlack is a modularized toolkit to do this. Everything’s built in PySpark. There’s a series of modules that are designed to find issues, provide diagnostic summaries to clients, and explain exactly why the issue is what it is not just using line and shelf, using counterfactuals—What if, why not? What if I change this type of analysis?
Correction modules that shift from ML-based approaches like autoencoders and isolation forest to Bayesian techniques, which pull the user’s input up front in that process.
Repair modules that are able to plug in seamlessly to enterprise-grade DQ systems, and the audit trails that give the governance that you need to make sure that for every single thing that gets changed, you’ve got a record of that. You can walk it back, understand why it was changed, who changed it, and when it was changed.
Through this set of modules and orchestration, we’re able to help dramatically accelerate a lot of the issues our clients face.
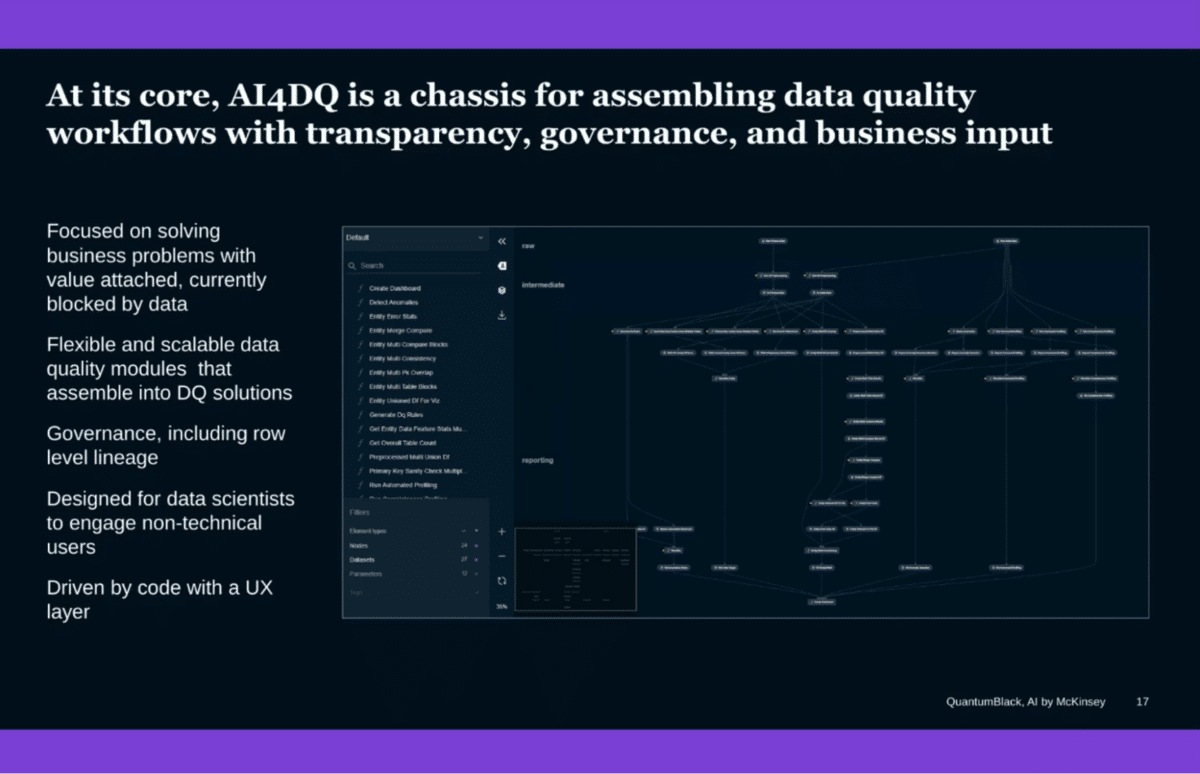
Practically, a lot of these different modules that you’ll see here are the right ones, but they themselves aren’t distinctive. What is special about this approach, and where we see this going in the future, is its chassis—this orchestration layer that provides the ability to connect these different algorithms in ways that detect, correct, and repair; are easy to assemble for business problems; that provide audit-level transparency and role-level governance; and allow non-technical users to engage in the data fixing process. For that, a big part of our toolkit includes Snorkel and other data-centric approaches. It is designed for data scientists to use and designed for real engagement from business users.
I’m going to talk about some examples as to how we’ve deployed this, and I like these examples because they show the impact of data cascading across supply chains. They show how small changes in a supplier, i.e. giving a distributor bad data, can result in an entire supply chain having 10% excess capacity.
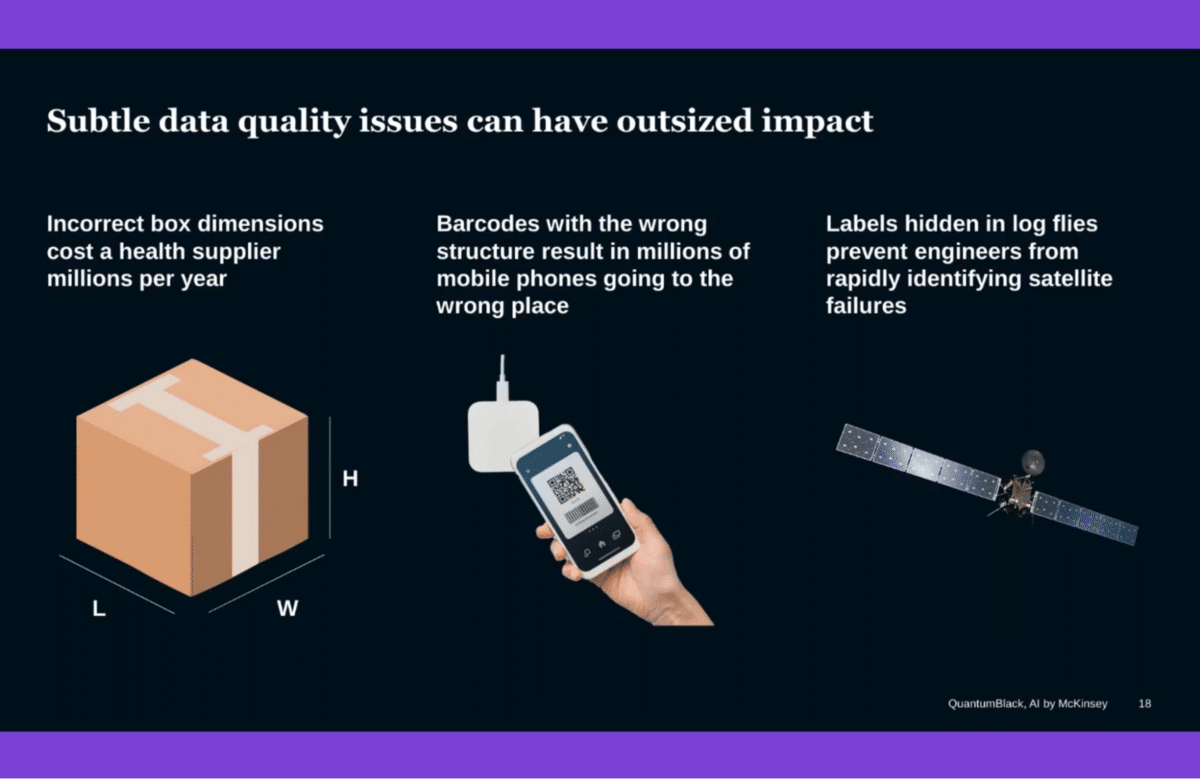
We’ll talk about a healthcare case where we were in the midst of the pandemic. They needed to ship more boxes and they couldn’t because they didn’t know how big their boxes were. We’ll talk about one of the biggest phone manufacturers in the world and how barcodes, something boring and small, were causing them enormous pain and backorders. Then, we’ll talk about our work with a space agency, one of the two biggest ones in the world, and how we use data-centric approaches to fix and correct data in signals between spacecraft and ground-stage communications, helping top engineers figure out what was going on, how to fix it faster.
This is my favorite example because it shows how something is boring as box weights and dimensions can cause the supply chain to carry 10% excess capacity due to data quality errors.
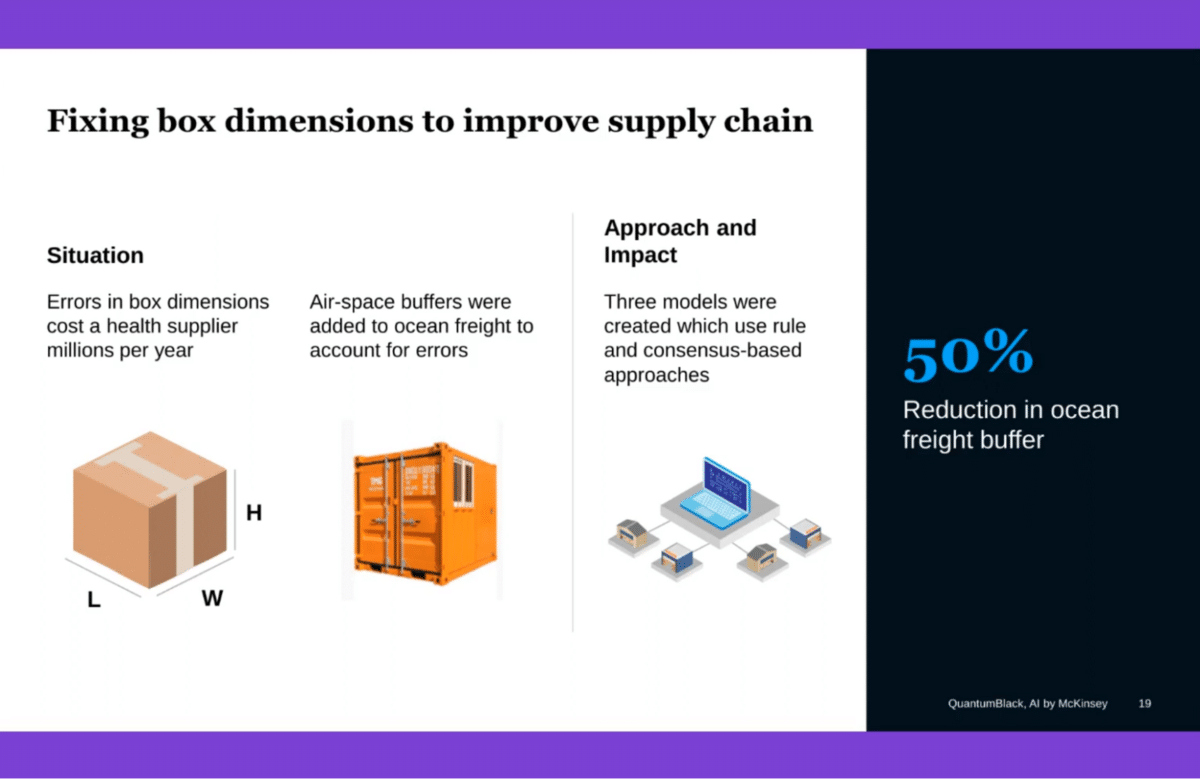
In this case, the context is the client is a big healthcare provider. They’re distributing a bunch of healthcare supplies (obviously) in boxes. In this case, their upstream suppliers weren’t providing correct information on how big the boxes were. As a result, they couldn’t fit their boxes in the containers properly, so they were paying for a 20% ocean freight gap—basically airspace in containers—because they couldn’t properly tetris their boxes into these shipping containers.
We deployed the toolkit you just saw, working with everyone from warehouse workers to the CDO to suppliers, to automate the correction of their data end-to-end, fixing data for around 30,000 products, and cutting the ocean freight buffer in half (to be conservative).
Their data went from 65% accurate at best, and a three-year window to phone up suppliers and get it fixed, to 98% accurate, validated through measurements and user interactions. It is a very powerful approach of bringing ML-based approaches to data.
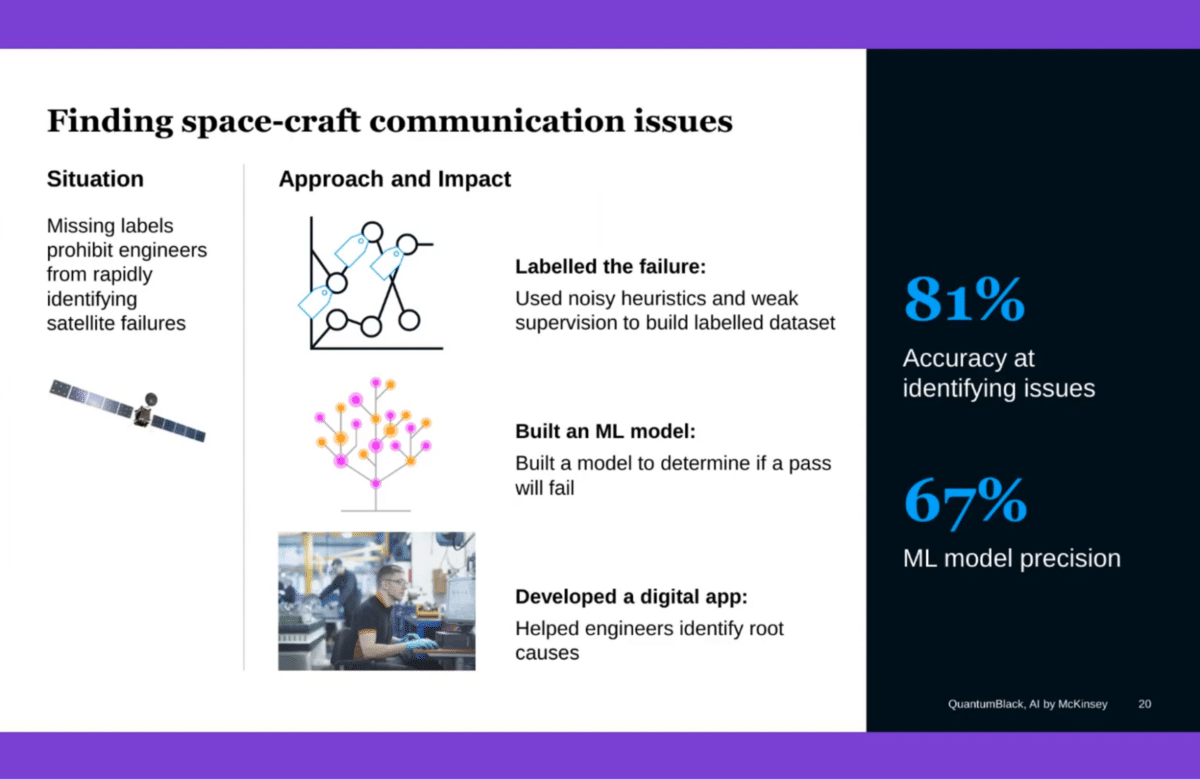
The next example is one of the biggest space agencies in the world. They’ve got satellites in space and they’ve got ground stations and they’re communicating. Whenever a packet drops or there’s a break in the signal, it gets buried in, basically, a log file on some server. It takes the engineers a few days to figure out that it broke and where did it break? Where’s the log file? How did it break? This just doesn’t allow you to react fast enough.
We, in collaboration with Snorkel, aimed to see if we could fix that data, so they could figure out what happened and more proactively take effect. We looked at the log files, used weak supervision to label them with the engineering team, and built an ML model to predict them. Now, they’re using this to instantaneously detect satellite-to-ground station communication failures, and then detect and identify the root causes as to what happened.
These are just two examples. This is a space that we see growing rapidly because the tools that need to be built to solve this problem don’t yet exist. We’re trying to build some of those, but we’re excited to work with the community to make them better.
Q&A with QuantumBlack
Aarti Bagul: Amazing! Thank you so much, that was really insightful.
One of the questions that came up was, you’re talking about your tool, finding issues in the data before you even get to the modeling stage. What are some of the techniques you’re using for your data validation cleaning process that you can maybe touch on?
Bryan Richardson: They’re dependent on the problem we’re solving. In some cases, it’s a massively parallelized regionic scan. In other cases, we use a lot of Bayesian techniques. The Bayesian networks are our big, we use a sort of custom implementation of those. We do a lot of stuff with large language models. Think Hugging Face, internally built ones, the usual suspects as well as the classical anomaly detection techniques.
The secret sauce for us in error detection was shifting this approach of just finding errors and piling them and users to taking input upfront and incorporating that knowledge into the model a-la some Bayesian priors.
AB: Are there certain types of data that you’re mostly working with and the tool is focused on right now?
BR: Right now we’re focused mostly on tabular data. Think transaction data, sensor data from different heavy industries, etc. We’re going to be shifting more and more into video in the next 12 months. Right now we’re doing a bit with images and a bit with unstructured text and structured data.
AB: We have some other questions around these finding errors, but I’m going to share another higher-level question, which is about how you approach projects.
Now that you know that even once you get to a model there is some iteration involved in terms of getting to the best model or maintaining the model and the data engineering, how do you plan projects at McKinsey and QuantumBlack? Do you account for that iteration cycle or what does that look like and how do you explain that to your clients as well?
Jacomo Corbo: It’s a continually evolving process. For quite a long time we’ve talked about trying to put in place protocols, to try to dimensionalize some of the complexity. We ultimately want to navigate, and break down a given scope into repeatable activities and workflows that are gonna be carried out by different technical practitioners. That’s all the way out from the work of technical and data architects, to the work of configuring and provisioning an environment in which development is going to take place, to how the data engineers are going to navigate their tasks, to how data scientists and machine learning engineers are going to do that to help DevOps engineers who are supporting teams end to end are doing a great deal of that.
A lot of those activities, the sequence of those activities, is a function of the technical scope of the project. That isn’t just arrived at and worked out, upfront. It’s something discovered and explored and they are going to be pivots throughout the process. Ultimately, as much as we’ve tried to refine how we scope projects and how we navigate to a tight, critical path, that ultimately amounts in something which… in some of the work that we’re doing, all we’re trying to get at are insights on the back of having mined given dataset.
But a lot of what we’re talking about here is trying to build data pipelines that are going to run. We’re talking about running code. As much as we’ve tried to template a lot of our delivery approaches and our implementation approaches, we still live in a world where you run into all the issues that I talked about, whose root cause (though we’ve got a pretty broad set of issues ultimately) is tied to data. That’s the meta point here. A lot of the issues are very granular, even at the level of data engineering. So much of the implementation effort is still tied to data engineering tasks.
Catch the sessions you missed!
The Future of Data-Centric AI 2023, our two-day free virtual conference, brought together thousands of data scientists, AI/ML practitioners, researchers, and the AI community at large to hear about and discuss the latest trends and research in data-centric AI. If you registered for the event but didn't see all the sessions you wanted, you can now catch up. The recorded sessions are available for registrants at the same Zoom portal as the live sessions.

Recommended articles
View all articles

Agentic AI evaluation: Closing the gap with better benchmarks and data
Alex Ratner, co-founder and CEO of Snorkel AI, spoke at @Scale: Systems & Reliability about one of the most underappreciated problems in AI deployment: our ability to measure agents has been outpaced — arguably for the first time in the history of the field — by our ability to build them. The talk digs into what it actually takes to close that
June 23, 2026
•
Snorkel Team

JudgmentBench: Comparing Rubric and Preference Evaluation for Quality Assessment
At our latest Snorkel AI Reading Group, Russell Yang (AI Engineering Fellow at Stanford Law) stopped by our San Francisco office to present JudgmentBench: Comparing Rubric and Preference Evaluation for Quality Assessment. As AI models improve at open-ended tasks, the field faces a harder problem: how to measure quality in domains where ground truth is contested. Two paradigms dominate: rubric-based
June 18, 2026
•
Snorkel Team

The Art and Science of Building AI Benchmarks That Shape the Field
Vincent Sunn Chen spoke at AI Engineer London about what it actually takes to build AI benchmarks that move the field forward, not just measure it. The throughline is an asymmetry that keeps showing up across deployments and the 150+ proposals reviewed for the Open Benchmarks Grants: agent capabilities are climbing fast, but the ability to measure those agents with
June 16, 2026
•
Snorkel Team

