Jack Zhou, product manager at Arize, gave a lightning talk presentation entitled “How to Apply Machine Learning Observability to Your ML System” at Snorkel AI’s Future of Data-Centric AI virtual conference in August 2022. The following is a transcript of his presentation, edited lightly for readability.
I’m a product manager at Arize. We are an ML observability company and today I’m going to talk about ML observability and how you can make ML observability work for your models in production.
Our agenda. First, we’re going to set the stage and talk about some of the challenges with productionizing machine learning models and then we’ll talk about some of the ML observability techniques that we think are very effective in terms of monitoring and debugging issues with your models.
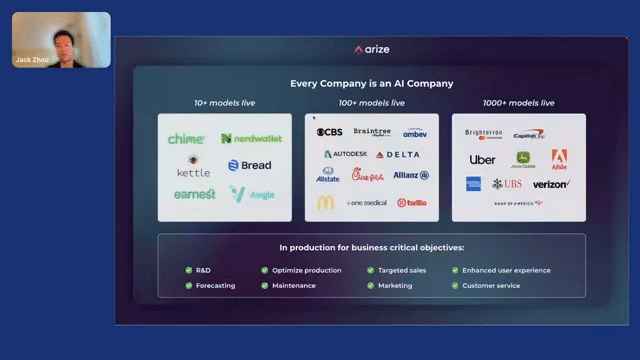
Why is this important? Obviously, I don’t need to say too much here because this is an ML conference, but what we see today is that every company in some way or another is an AI company. Either these companies make AI a central part of their business, or a lot of large companies actually use AI in various parts of their business units for predicting demand and for pricing. So ML ends up being a huge part of many large companies’ core functions.
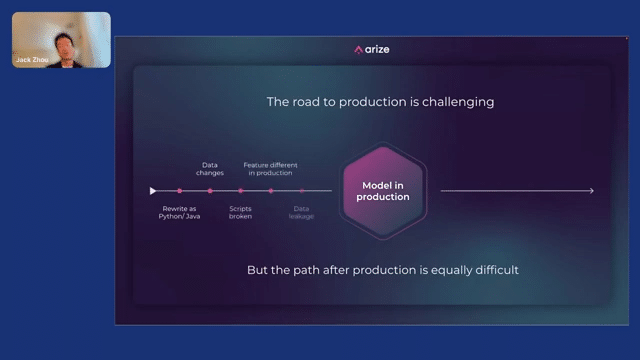
As you’re probably aware, the road to production is pretty challenging. So on the left, you can see, in order to productionize a model, maybe you have to rewrite the model. You have to check that your production features are the same as your training features. You have to make sure that your ETLs are locked down. And then you get to the model in production.
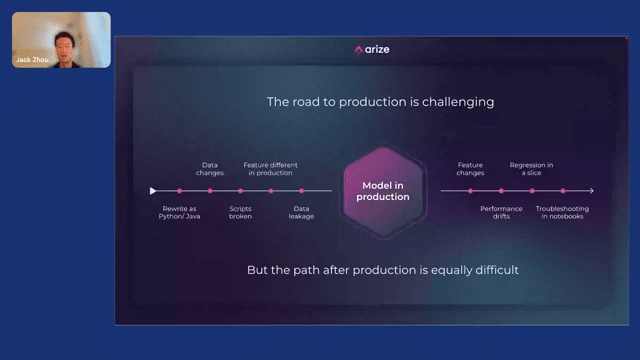
And we wish that was the end of the road, but in fact, that’s just the start of another set of processes and issues that can happen. So once your model’s in production, potentially your features could change. This could lead to performance drifts. Performance drifts can lead to regression for a slice of customers. And usually what ends up happening is that some poor data scientist or ML engineer has to manually troubleshoot this in a Jupyter Notebook.
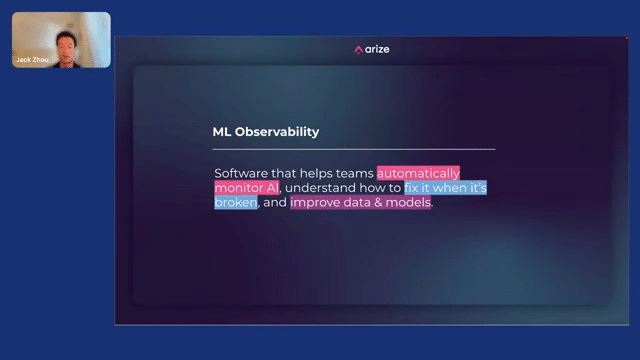
So this path on the right side of the production icon is what we’re calling ML observability. ML observability is software that helps teams automatically monitor AI, understand how to fix it when it’s broken, and improve their data and models along the way. I think we’ve heard in conversations and in some literature, the words ML observability and ML monitoring being used interchangeably.
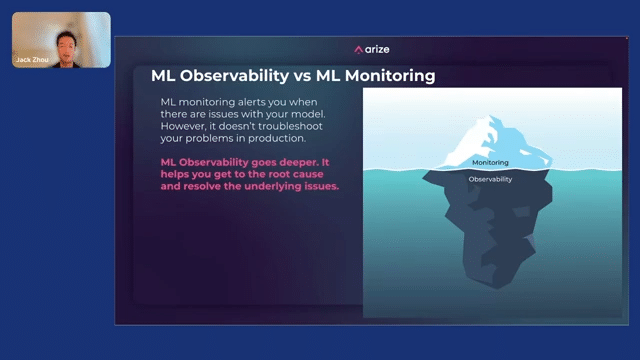
But here we want to distinguish these two concepts. ML monitoring is what alerts you when there are issues with your model, but it doesn’t really tell you how to fix it and how to debug it, versus ML observability, which goes a little bit deeper. It helps you get to the root cause and resolve the underlying issues.
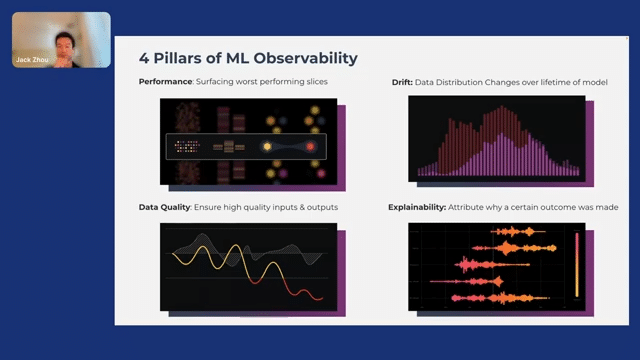
We’re going to talk about mostly ML observability in the next slides. We have four pillars that we use when thinking about ML observability. First is performance, of course, because this is what affects the customers. The second is drift. How do you detect changes in distribution? Then there’s data quality, and then explainability. I’m going to go through each of these concepts.
The first pillar is performance tracing. What does that mean? ML performance tracing is the methodology for pinpointing the source of a model performance problem, and then mapping it back to the underlying features that cause that problem. Typically we think about this in three steps.
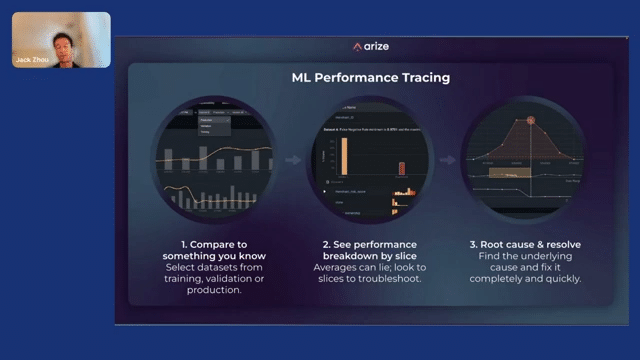
First, you want to compare the performance they’re seeing now to a baseline, and that baseline can be training or validation, or it could even be a stable time in production in the past. This will help you understand if the performance is actually degrading, and if so, where is the performance degrading?
Second, you want to see a breakdown by slice. You want to understand what is causing this performance breakdown. Not only do you want to know what features are causing this or impacting the performance, but potentially you even want to know what values of this feature or (if it’s a categorical feature) what categories of this feature are having the most impact on performance.
And last, you want to be able to root cause this issue. You can dive deep into the actual feature or the value of the feature that’s causing the issue. This actually brings me to my next slides.
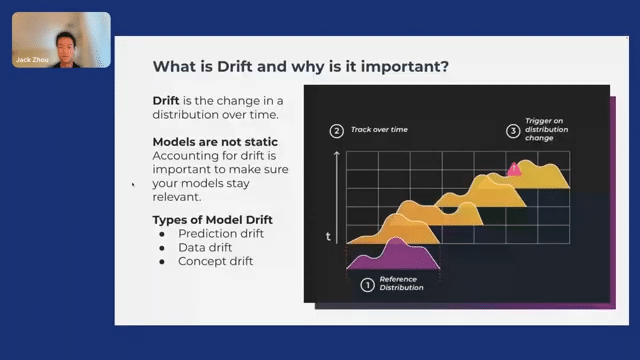
The next pillar is drift. What is drift and why is it important? Drift is defined as the change in distribution over time. Everyone probably knows that models are not static. Features are not static, and in fact, the world is not static. That falls into three categories of model drift, which are prediction drift, data drift, and concept drift. Approaching drift resolution looks very similar to how we approach performance tracing.
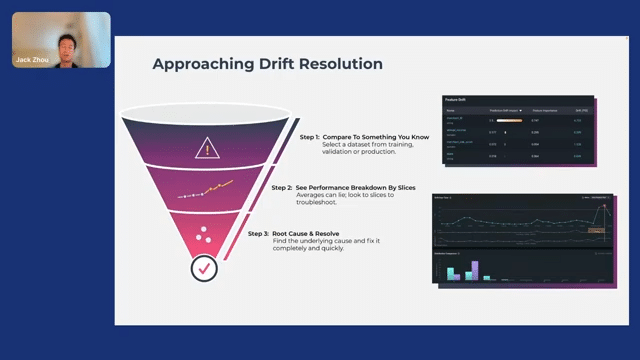
Drift is fundamentally a comparison between two datasets. The baseline data set is something that the user can pick that is a stable dataset. So again: training, validation, or a period of time in the past when the production data was stable. We can break down the performance into slices. You can see on the top right, you can break it down into both the importance of features as well as the impact that each feature could have on prediction drift.
And last, you want to root cause it. Here you can see the distribution, which will help you understand which values of this feature are drifting. It may not be all values, it may just be a very small subset. You can see here in the time series that the drift actually started recently. So this is going to help you figure out temporally, when to start debugging the issue.
The third pillar is data quality. And data quality is defined as data issues such as missing data or invalid data, high cardinality data, or duplicated data. And this all affects drift and performance. So how do we debug this? First, you probably want to profile your data because you want to understand a baseline for your data. And then second, you can set up monitoring on that.
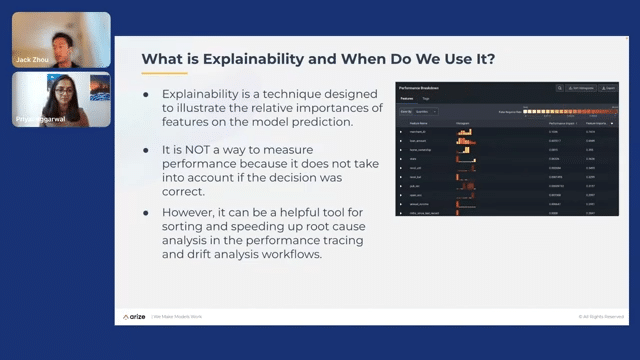
And last is explainability: the technique to understand the relative importance of features on the prediction. And this won’t help you understand performance issues, but it will help you debug by ranking your features so that if you have a hundred features per model, this helps maybe the top five features to look at.
Catch the sessions you missed!
The Future of Data-Centric AI 2023, our two-day free virtual conference, brought together thousands of data scientists, AI/ML practitioners, researchers, and the AI community at large to hear about and discuss the latest trends and research in data-centric AI. If you registered for the event but didn't see all the sessions you wanted, you can now catch up. The recorded sessions are available for registrants at the same Zoom portal as the live sessions.

Recommended articles
View all articles

Agentic AI evaluation: Closing the gap with better benchmarks and data
Alex Ratner, co-founder and CEO of Snorkel AI, spoke at @Scale: Systems & Reliability about one of the most underappreciated problems in AI deployment: our ability to measure agents has been outpaced — arguably for the first time in the history of the field — by our ability to build them. The talk digs into what it actually takes to close that
June 23, 2026
•
Snorkel Team

JudgmentBench: Comparing Rubric and Preference Evaluation for Quality Assessment
At our latest Snorkel AI Reading Group, Russell Yang (AI Engineering Fellow at Stanford Law) stopped by our San Francisco office to present JudgmentBench: Comparing Rubric and Preference Evaluation for Quality Assessment. As AI models improve at open-ended tasks, the field faces a harder problem: how to measure quality in domains where ground truth is contested. Two paradigms dominate: rubric-based
June 18, 2026
•
Snorkel Team

The Art and Science of Building AI Benchmarks That Shape the Field
Vincent Sunn Chen spoke at AI Engineer London about what it actually takes to build AI benchmarks that move the field forward, not just measure it. The throughline is an asymmetry that keeps showing up across deployments and the 150+ proposals reviewed for the Open Benchmarks Grants: agent capabilities are climbing fast, but the ability to measure those agents with
June 16, 2026
•
Snorkel Team

