The future of data-centric AI talk series
Background
Michael DAndrea is the Principal Data Scientist at Genentech. He earned his MBA from Cornell University and a Master’s degree in Computing and Education from Columbia University. He currently works on using unstructured data sources for clinical trial analytics and his team is partnered with the Stanford “AI For Health” initiative as well as Stronghold AI to enable this work. Michael presented at the Future of Data-Centric AI virtual event, where he discussed how Genentech is making the shift to a data-centric approach for the clinical trial design process using information extraction.
This presentation is summarized below. If you would like to watch Chris’s presentation, we’ve included it here as well, and you can find the entire event on our YouTube channel.
Augmenting the clinical trial design process utilizing unstructured protocol data
Let’s talk about the shift to a data-centric AI approach in the clinical trial protocol design process for pharmaceuticals, but first I want to give you some background on clinical trial protocols and how they fit into the bigger picture of medicine and their impact on patients. First, I will show you a few key statistics about drug treatment and development.
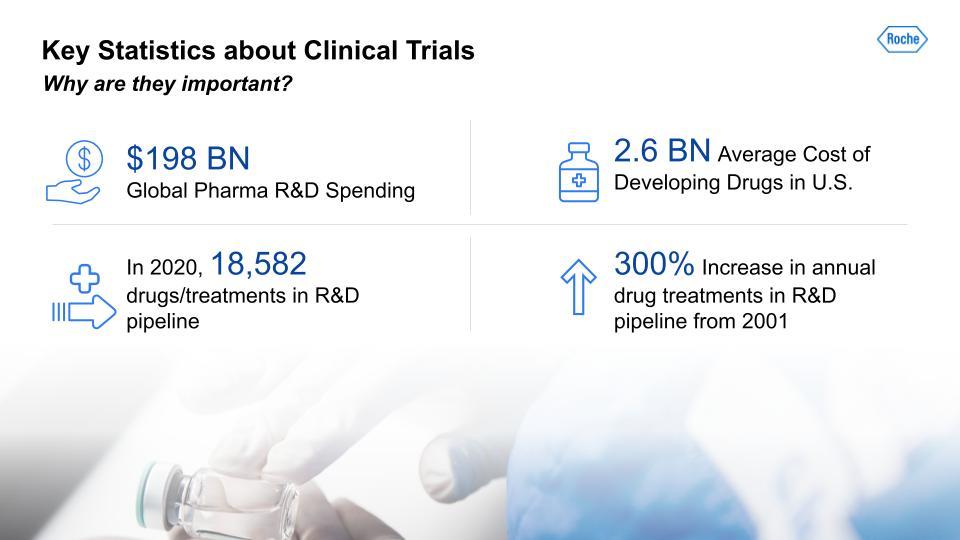
In 2020, pharmaceutical companies around the world spent a total of $198 billion on drug development, with an average in the United States of $2.6 billion per drug. This dollar amount includes the entire cycle of a drug, from initial research to patient utilization. Also in 2020, there were 18,582 drugs and/or treatments in the research and development (R&D) pipeline, and this number has been steadily increasing since the beginning of the current century. In fact, there has been over a 300% increase since 2001. These statistics really demonstrate how improving or augmenting clinical trials can have a tremendous impact on cost and outcomes for drug trials.
So: What is a “clinical trial protocol?” In essence, it is “the plan” for a drug trial. It includes the study design; which patients the study will exclude or include; and what types of assessments and procedures the patients in the trial will undergo. The protocol also describes a given study’s objective, methodology, population, and organization. Usually, it is all in the form of a PDF file.
These PDF files often get quite lengthy—200 pages or more. And the design of a protocol has a tremendous impact on a trial’s performance metrics. Such design elements include a protocol’s operational complexity, whether it is site friendly or burdensome, and whether it is patient-friendly or burdensome.
Now that we know a little bit about what a clinical trial protocol is, I want to go over the broad impact of using unstructured data in these clinical trials.
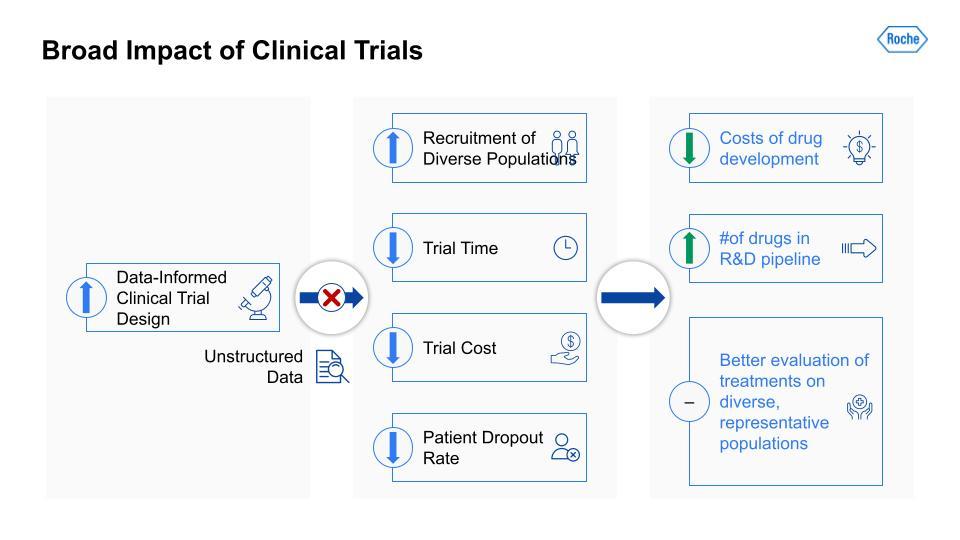
Traditionally, there has been a lot of useful information that would be applicable in a clinical trial but it is unstructured and so largely blocked. If we can unblock this information and open it to analysis and data-informed decision making, study design teams can increase their recruitment of more diverse patient populations, reduce the time and costs of a given trial (often through more efficient recruitment), and lower the patient dropout rate. Improving these metrics can, in turn, reduce the costs of drug development more broadly and increase the number of drugs in the R&D pipeline at any given time. The result would likely be more effective treatments and better evaluation of treatments on diverse, more representative patient populations, which means a better measure of a particular drug’s real-world efficacy.
Traditionally, there has been a lot of useful information that would be applicable in a clinical trial but it is unstructured and so largely blocked.
But there are some real challenges with using unstructured data in a clinical trial protocol.
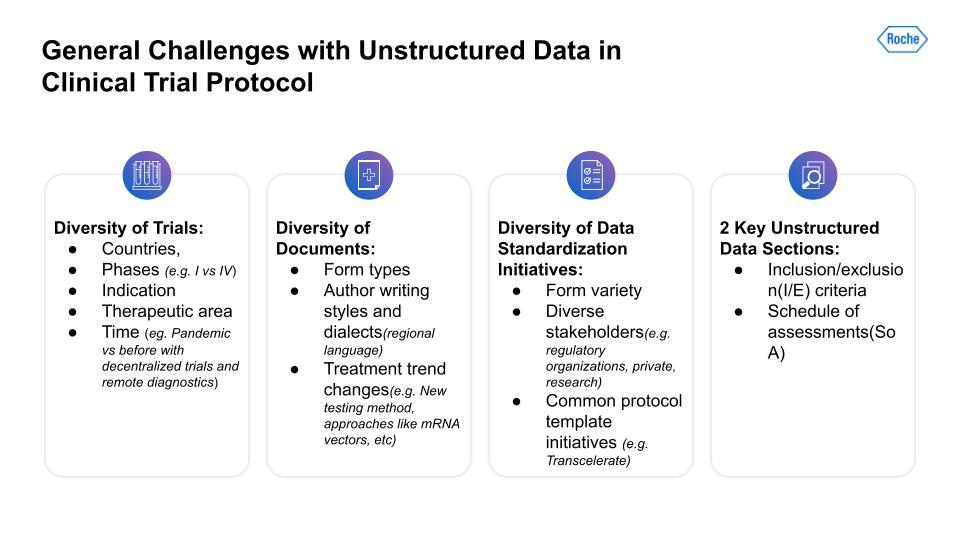
First, there is a lot of variability and diversity across different trials. The variables range from geography to the number of phases; indications to therapeutic areas; and differences between trials across time—for example, trials that have had to adjust to the COVID pandemic using decentralized trials and remote diagnostics.
Second, the diversity of protocol documents presents a challenge. Documents are formatted in distinct ways across different trials. There are also author stylistic differences, regional language or dialect differences, and changes in treatment trends, for instance, the advent of new testing methods and approaches not used previously.
Thirdly, there is the lack of data standardization initiatives. This problem has been a challenge for a long while now and will likely continue to be so. Drug trials are a complex field with a broad array of stakeholders, each with very different incentives, for instance, the concerns of regulatory organizations versus those of private research teams.
Key unstructured data sections
So, what parts of a protocol might yield useful information? To begin I will focus on a few things from our business and design team partners. These are: 1. Inclusion and exclusion criteria (I/E)2. Schedule of Assessments (SoA)
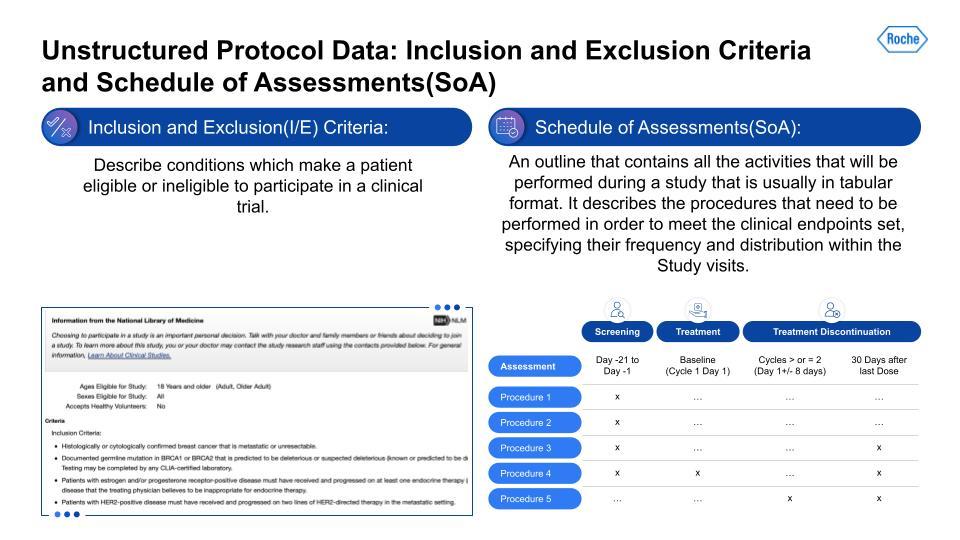
Inclusion and Exclusion Criteria (I/E) is essentially the filtering checklist design teams use to determine whether a given patient is eligible to include in a trial. These I/E criteria can often be quite detailed and complex. Even a seemingly simple condition can have multiple dependent conditions that branch from them.
The Schedule of Assessments (SoA) is an outline that contains all the activities that will be performed during a study, usually in tabular form. It describes the procedures that need to be performed in order to meet the clinical endpoints set, specifying their frequency and distribution within the study. These procedures can range from screening patients to specific lab-work assessments that check on key lab values throughout the trial. The timing and duration of these procedures can vary significantly between studies, and so it presents a particular challenge to harmonize the data emerging from them.
Next, let’s discuss how data-centricity played a major part in extracting useful information from these protocols and that data’s potential for having real-world impacts in a shift from a model-centric to a data-centric AI approach.
CRISP-DM with model-centric AI
You might already be familiar with the CRISP-DM framework, which is the most common way of structuring a data science project that continually iterates. We tried a gamut of approaches that built upon sophisticated modeling approaches on larger medical data. Even the combination of NLP libraries, unsupervised learning techniques, and medical BERT-derived models were limited in terms of having a real business clinical impact at scale. The challenge for many experienced practitioners is that data scientists are excited about the new modeling approaches and advanced research, and so keep the data fixed and focus less on approaches that augment the data.
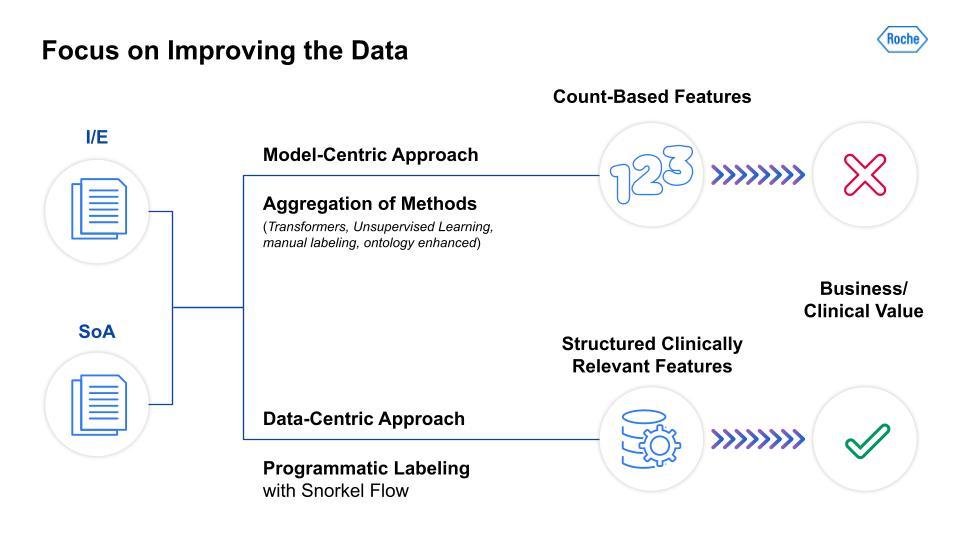
As the above image illustrates, the differences between model-centric and data-centric approaches are dramatic. As I mentioned, we took an aggregation of model-focused methods and were only able to derive count-based features, which had little clinical value for our teams. In contrast, the data-centric approach leveraged programmatic labeling with Snorkel Flow. This yielded structured, clinically relevant features that our clinical scientists and study design teams could use for analysis and data-informed protocol design. The next two steps in our data-centric AI journey involve the actual two parts of the protocol, I/E and SoA, which were the basis for our team’s work.
Inclusion/exclusion problem statement
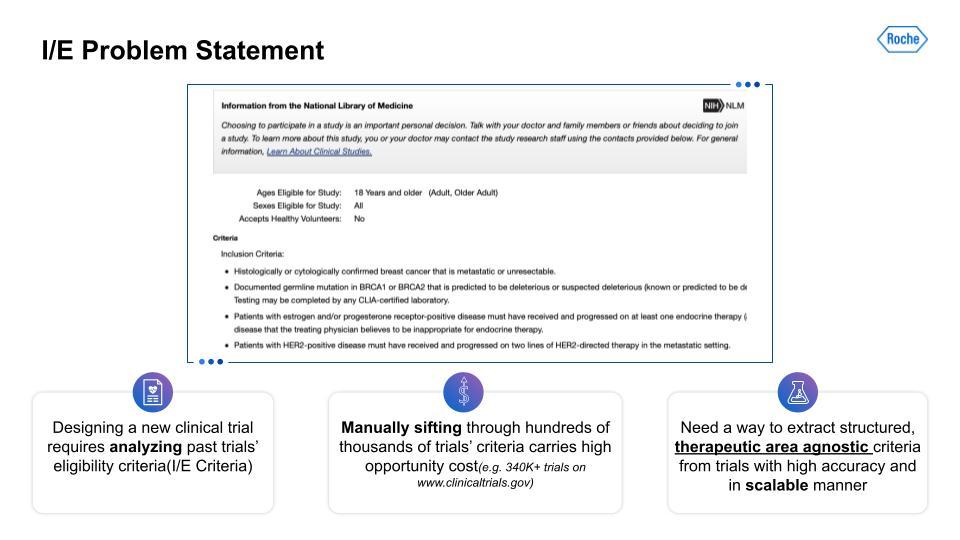
The design of a trial and especially its inclusion/exclusion(I/E) can benefit from analysis of large numbers of other similar trials. The current method of doing this is manual, done on a small scale, and with certain biases reinforced due to personal familiarity with specific types of research, indications, etc. Manually sifting through hundreds of thousands of trials looking for patterns on large-scale, relevant subsets for clinically relevant characteristics is especially challenging. This becomes all the more clear when we factor in the broad variety of technical medical terms and jargon, synonyms, and conditional values that exist in this field.In order to find broad patterns that could be used for study design teams, we first needed to find therapeutic-area agnostic characteristics. This would yield some data that would be immediately generalizable for study teams. So, what type of information would be therapeutic-area agnostic?
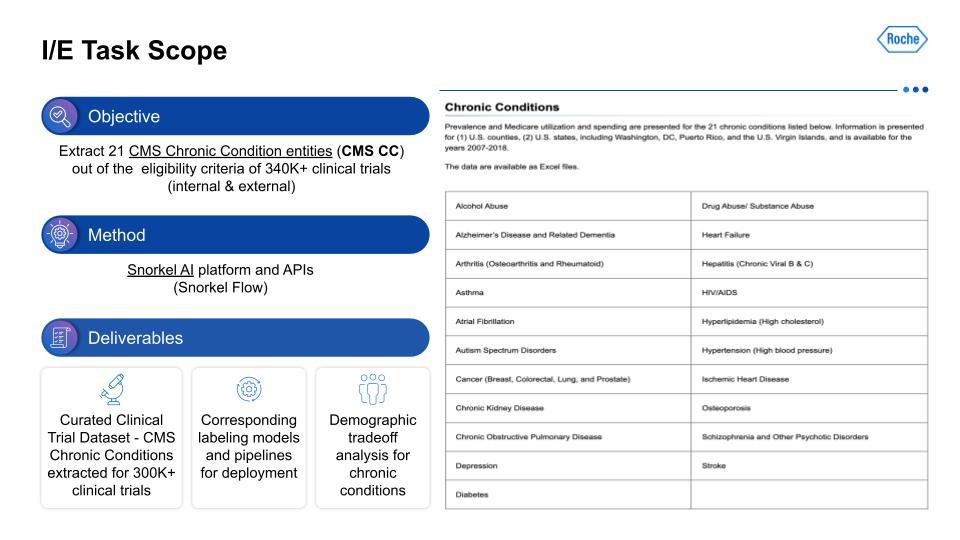
We targeted the 21 chronic conditions that have been identified by the Centers for Medicare and Medicaid Services (CMS), which all have linked ICD-10 codes, to help with finding therapeutic-area agnostic information.How did we accomplish this? Using Snorkel AI’s data-centric AI platform—Snorkel Flow—we were able to deliver a dataset that we hope to share publicly at a later date, as well as the corresponding labeling models and pipelines. This data was the foundation for demographic tradeoff analysis functionality and tooling, which was the basis for even more exciting impacts beyond this project.For the I/E task setup, this visualization on the left serves as an example of the kind of input that is being taken in, with multiple chronic conditions in the breakout of I/E.
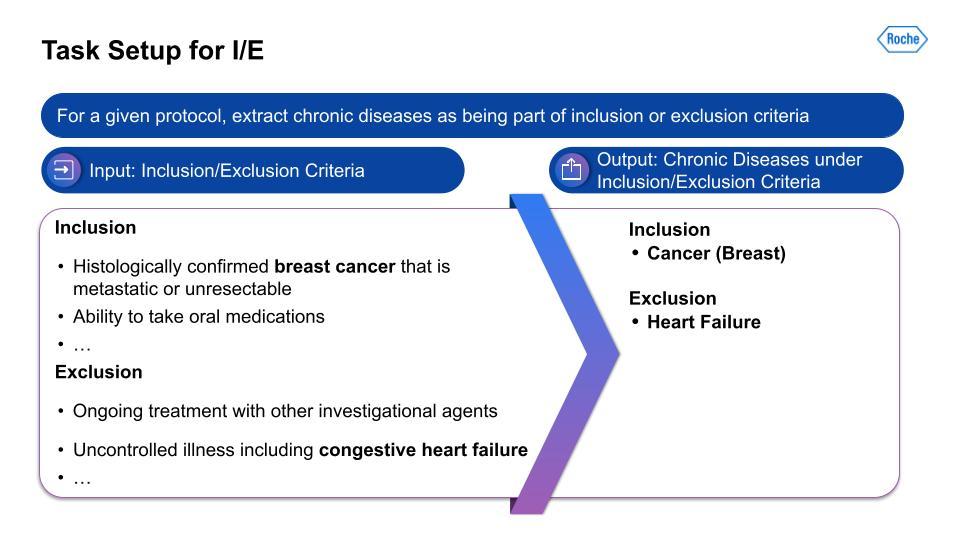
Then, on the right, is the output from the data-centric pipeline that determines if the chronic condition is in the I/E.
Information extraction challenges with inclusion/exclusion data
I do want to take a moment to discuss the types of challenges you encounter with I/E data, and demonstrate that this is far from a trivial problem.
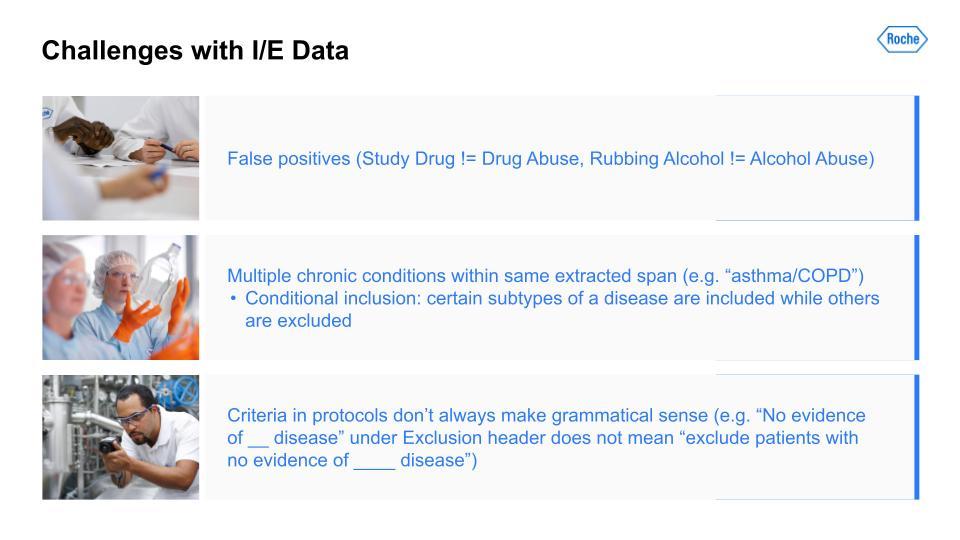
For a first example, given how we were extracting criteria related to drug abuse, is the creation of false positives. You can see the confusion with references to “study drug” or even the example “rubbing alcohol” were unexpected false positives that would not have surfaced if we had not used the data-centric approach, which allowed us to really iterate and learn the data inside and out. The second example was to do with chronic conditions often having crossover with one another. The challenges of this are compounded further by conditional causes.Lastly, there were actually grammatical errors in the protocol, and negation was especially tricky to fix. All of that is to simply note that this is still very much a process and that we are continuing to improve the data. By no means did we catch everything, but these examples really opened our eyes to the complexity of what would otherwise have been completely hidden if we had not focused primarily on the data.
Information extraction data-centric pipeline
Below is an image of the data-centric pipeline that we built to accomplish this:
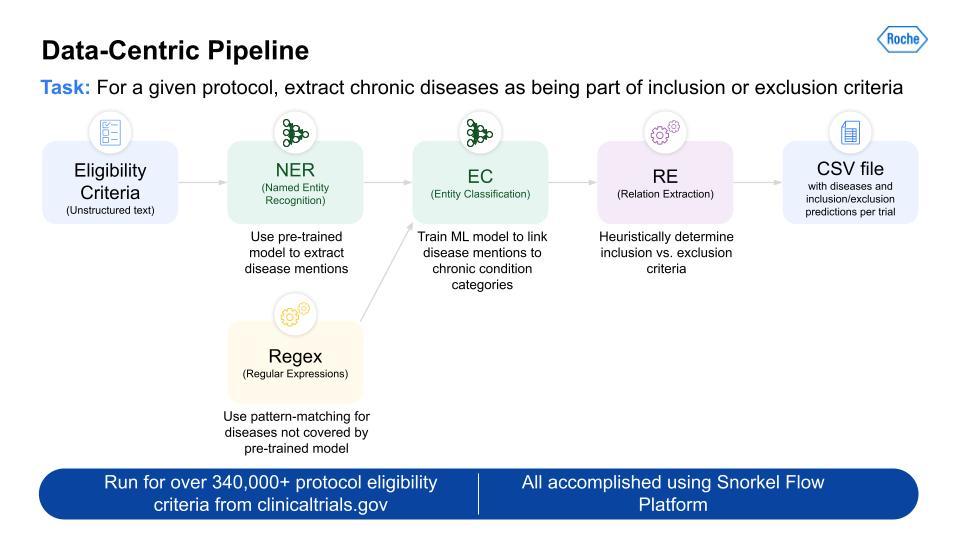
This is a complex multi-step pipeline that can be extremely difficult to orchestrate with even a highly skilled data engineering team. But Snorkel Flow made this pipeline development almost a drag-and-drop experience. This pipeline was run over more than 340,000 protocols, and gave us the output for all 21 CMS chronic conditions.
This is a complex multi-step pipeline that can be extremely difficult to orchestrate with even a highly skilled data engineering team. But Snorkel Flow made this pipeline development almost a drag-and-drop experience.
Information extraction I/E results
Using the data-centric pipeline, the results are very strong and generalizable on both the validation and test sets.
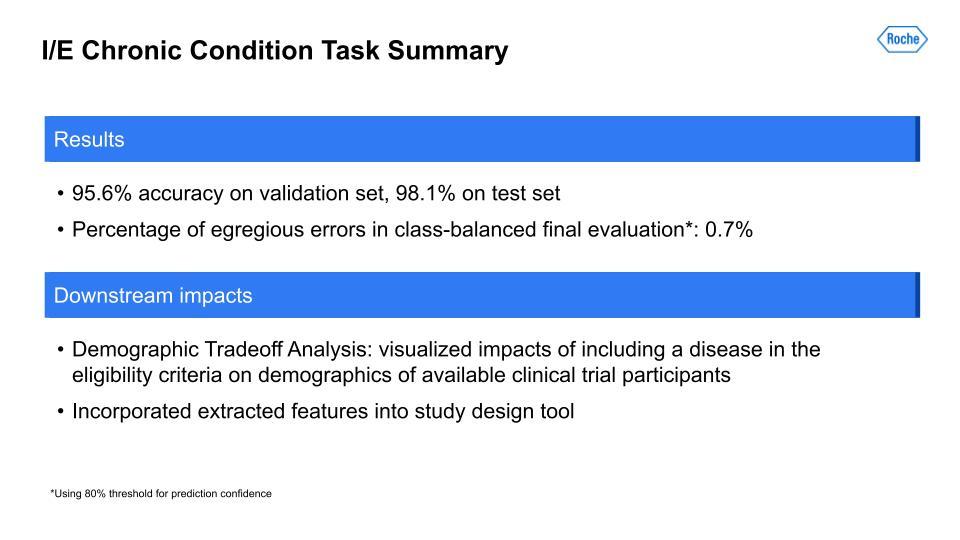
We also did another evaluation, which we call “egregious error” evaluation, and it was about catching the types of errors that are quite obvious and easy to diagnose. For this metric, we were able to essentially reduce it to zero—really incredible. Given this great performance on the dataset we created with the I/E CMS chronic conditions, we were able to use it for the demographic tradeoff analysis that I mentioned before. This is really exciting work, and it allows us to find the implicit biases that exist in our data. Additionally, a secondary downstream impact was the incorporation of this data into the analysis for the study design tool that clinical scientists use. For the final step on our data-centric journey, let us look at the data-centric SoA.
Schedule of assessment problem statement
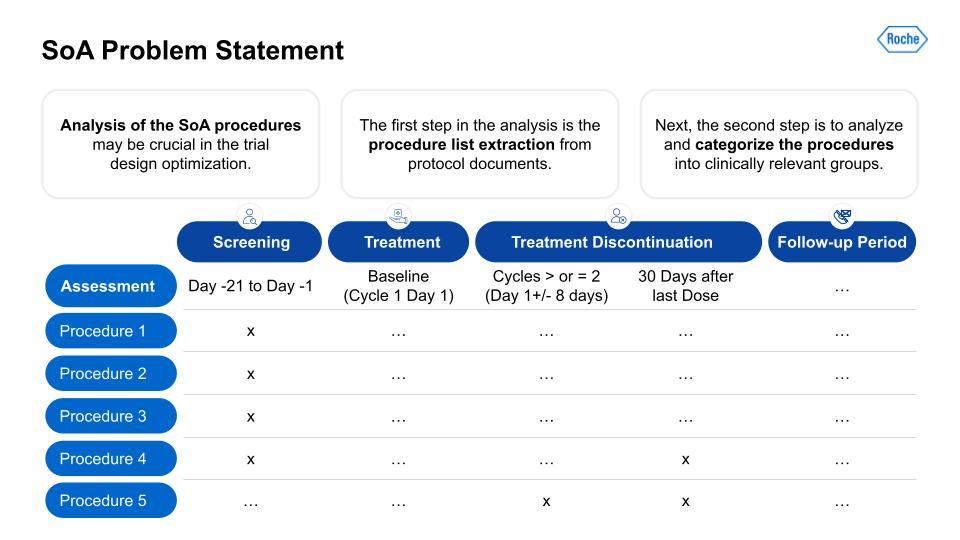
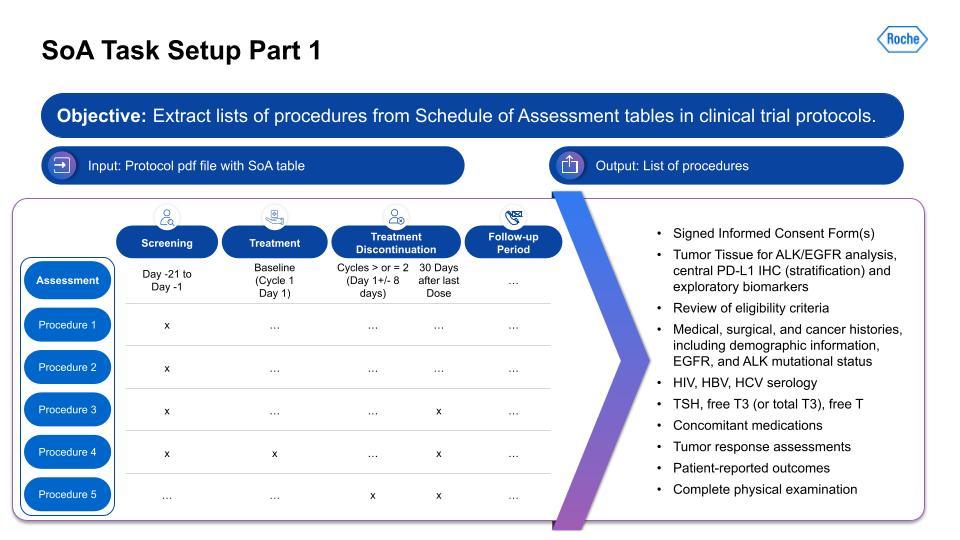
The column on the left here is usually for the different procedures in a protocol. Think of it like the steps planned for a trial. They can be different depending on the trial, and this variability is definitely obscured by this simple example, because the reality of the case is pretty complex. We first have to extract the procedures from the first column, then we need to categorize that list of procedures into clinically relevant categories. Let me explain:
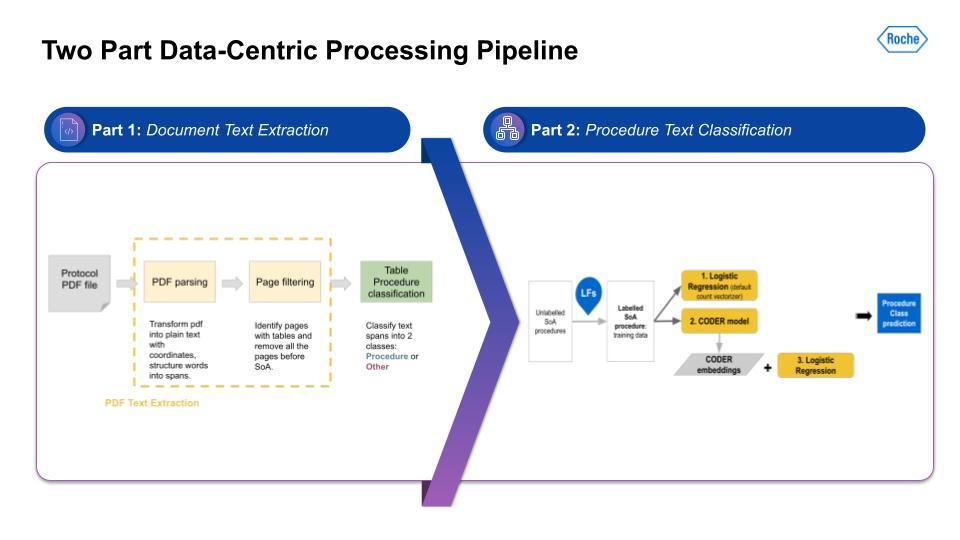
SoA information extraction task scope
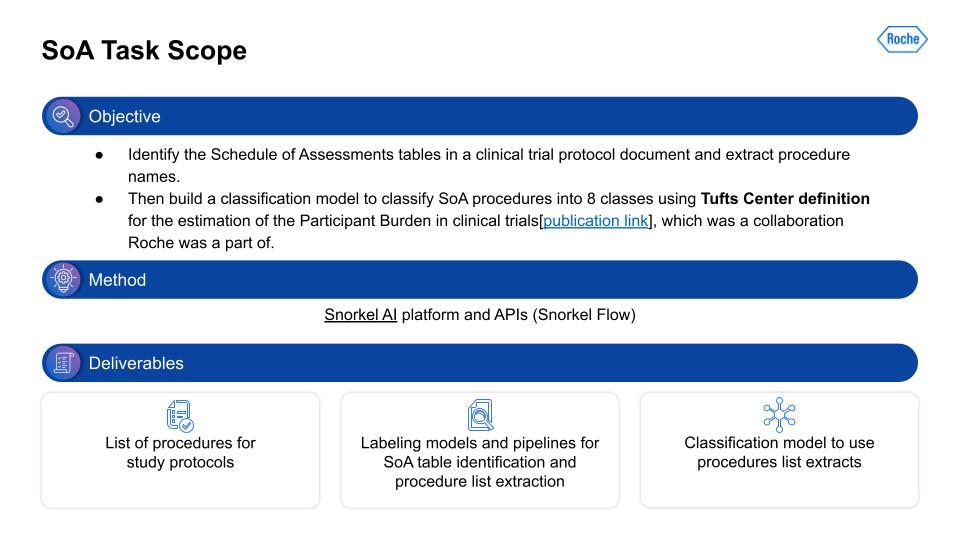
I want to extract information from the Schedule of Assessment (SoA) tables in the PDF document. This is a lot of work and it takes a lot of steps to even find the right table, and then to build the right representation to extract only the procedures from that table. Next, given this procedure information extracted from the table, we need to categorize the procedures. We used a categorization schema derived from work carried out at Tufts. Similar to the I/E, we again used Snorkel Flow. The output was a list of procedures with the Tufts categorization as well, and the supporting text classification model. At first, that seems relatively straightforward. That is, until you actually start working with the data.
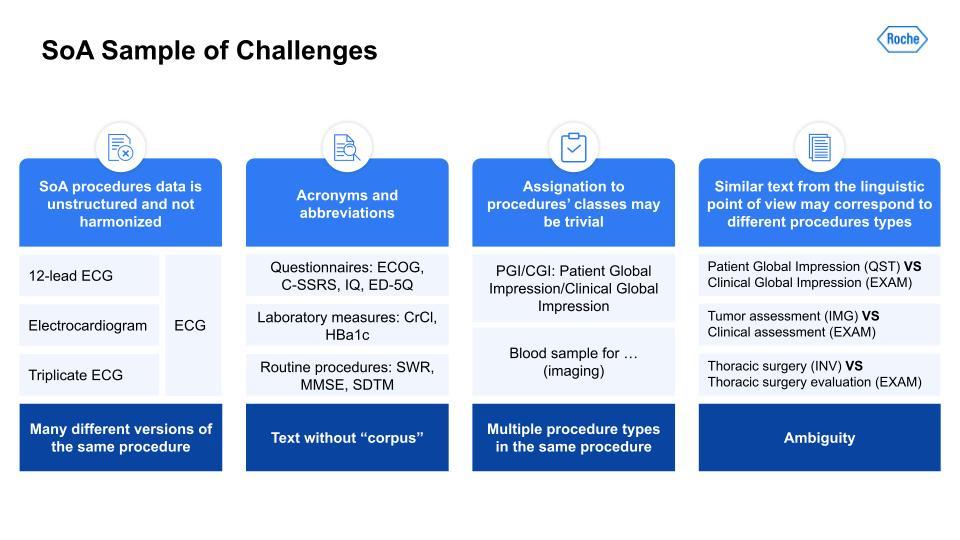
Just like with the I/E task, there are many challenges here. Harmonization of terms like the ECG; acronyms and synonymous terms are very common; and even ontologies and keyword masking systems had a difficult time detecting these. There also could be multiple procedure types within the same procedure. Lastly, very similar text could throw off the text-similarity algorithm, as you can see with these examples in the right-hand column, for example: Patient Global Impression vs. Clinical Global Impression.With the scoping, the task setup was a little simpler. The first task can be illustrated with the below visual. As you can see, the table has some procedures. Those are output to a list of procedures on the right.
For part 2 of the SoA task setup, we have the text classification of procedures:
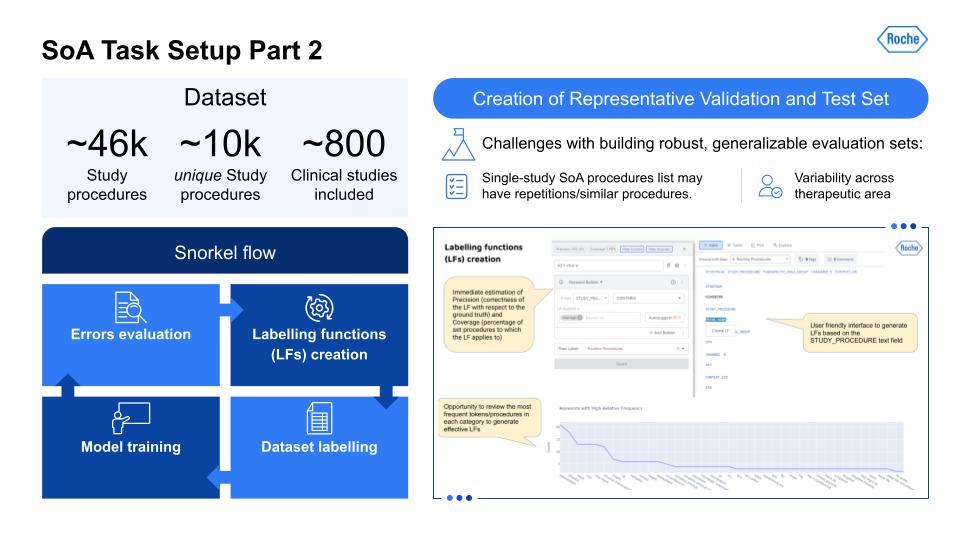
As can be seen in the above overview, the creation of representative evaluation sets that are robust and generalizable is the key to getting a real indicator of how it would work in production. Using Snorkel Flow, we were able to iteratively improve and work on these data. As you can see in the UI on the bottom right, this is how you would iterate through this cycle. Here’s a high-level technical overview of the work our team has done:
Again, the key point is that the ability to build complex, multi-stage solutions allowed a lot of flexibility, iteration, and innovation that would otherwise not have been easy if we had used another solution or platform. So, did this complexity yield good results?
SoA information extraction results using Snorkel Flow
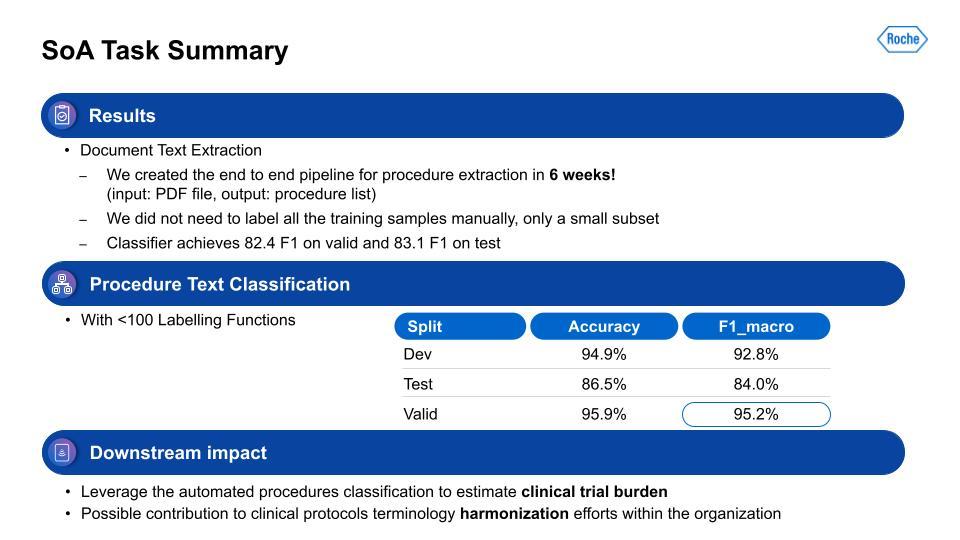
For the information extraction task, our team was able to get it to a working solution within only six weeks. We aimed for 80% or higher on F1, and we surpassed that within the timeframe. With the second step, the procedure task classification, this performance was also quite strong. Lastly, how does this all impact the business or the patients? This output is used for estimation of clinical trial burden and the analysis of study design in the tool I mentioned earlier. It’s also contributing to the harmonization of data within the organization, and has the ability to more flexibly adapt to changes in schema, since this is programmatic.After Michael’s presentation, there followed a brief question-and-answer session, which is summarized below:
Q & A
Q: When you find false positives, what is the process for iterating to mitigate them?
A: It depends on the process, and like we’ve said, there are different types of errors. Certain errors are “more” wrong than others, if you will. So, an egregious error validation, your traditional machine-learning metrics are F1, your precision-recall—these are kind of the common metrics. But we also wanted to have maybe a held-out sample that can be valued by a different group to reduce the bias within the implementing team.
Q: What does careful curation of a validation and test set involve?
A: Yeah, as we mentioned, with clinical trials there is a lot of variability. It’s a lot of different therapeutic areas—oncology, neurology, etc.—there are wide differences. And then the size of the trial plays in here. An early Phase 1 trial is very small. But in these phase 3 or 4 trials there are tens of thousands of patients.
You have to look across different geographies as well. You really have to understand, are you overly skewed toward earlier trials? What are the regulatory differences between a pre-2015 trial and a post-2018 trial? So you have to be aware of these differences and make sure you get a representative sample because it might seem like you’re doing really well but when you test it in real-world production use-cases it might not work as well as planned.
The advantage of Snorkel Flow is that with programmatic labeling, if we know the changes, we have the tools to iterate and adapt, we’re able to change even the schema and how we define things. It is really important to not have to re-label everything manually.
Scaling is really the key thing. Scaling to adapt to a bunch of different challenges and doing so with a small team is really tough. I think that was what was really powerful about this project.
Q: Do any of these techniques help predict the result of a clinical trial sooner, ahead of time, or with less information?
A: That’s a great question. We actually do look at the clinical endpoints and we are correlating. These are all correlations, of course, and things can change, so it doesn’t mean correlation equals causation. But, yes there is a strong correlation we are seeing in the data. We do hope that this will eventually help lead to better-informed trials. It is definitely mostly up to those clinical scientists and study design teams who have the experience and domain expertise. So, use this with some caveats. But yes, we definitely see some impacts, especially in things like the demographic bias analysis. There are things like asthma or hypertension where we weren’t aware of certain populations with these things, but the data is now bringing these correlations to the surface.
Q: What are some other use cases that you’re excited to work on next?
A: I think just continuing to scale this work. We just looked at the 21 chronic conditions and being able to do more. Like, taking this to more ICD-10 codes; being able to do more documents. The protocol, as mentioned, is 200-plus pages so there are other section endpoints. And with those endpoints: are we measuring the right endpoints? There are so many different things that the challenge is just pulling this information in a manner that can be structured and analyzed. That’s where the heavy lift is.
Q: How were the six weeks spent? Which part of the pipeline development took longer than others?
A: From my perspective, it seemed like so much of it was just understanding the data. This whole data-centric approach: understanding the data, understanding the challenges. Ironically, maybe the labeling functions become much more straightforward once you figure that part out and understand it a bit.
Q: What feedback would you give to the average clinician to improve their data for future modeling?
A: Being able to look at the wider variety of data, and be able to leverage tools that can examine broader patterns. I think a lot of the problem right now is clinicians just don’t have the tools. They do what they are familiar with, looking at small subsets, building a spreadsheet. But now that we have the ability to structure larger pieces of data, we can look at the broader trends. And I think that is exciting moving forward. Now we’re able to extract broader patterns. Take the chronic conditions. They can see, ok, “if I exclude some of the asthma cases how does that impact demographics? How does it impact endpoints?” How does it impact a lot of other things that they weren’t able to see before because it wasn’t scalable for them to read a hundred thousand protocols and categorize that?
To learn more about how Snorkel Flow can take your information extraction tasks and end-to-end AI development to the next level, request a demo or visit our platform. We encourage you to subscribe to receive updates or follow us on Twitter, Linkedin, Facebook, Youtube, or Instagram.